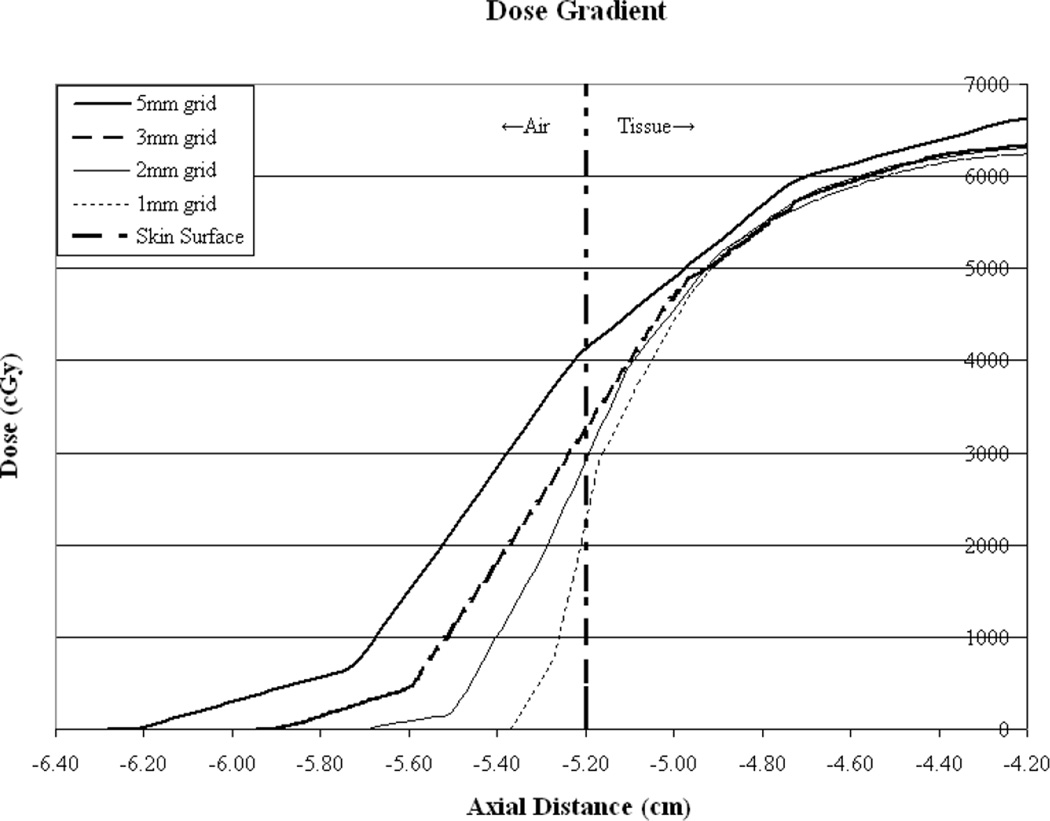
Figure 5.
Illustration of TPS calculated dose in the skin-to-air boundary region for all calculation grid sizes. It can be seen that dose is calculated for approximately 2 voxels outside the phantom surface and therefore a more rapid dose fall-off is demonstrated for smaller calculation voxel sizes. Dose inside the phantom appears to increase at similar rates.

