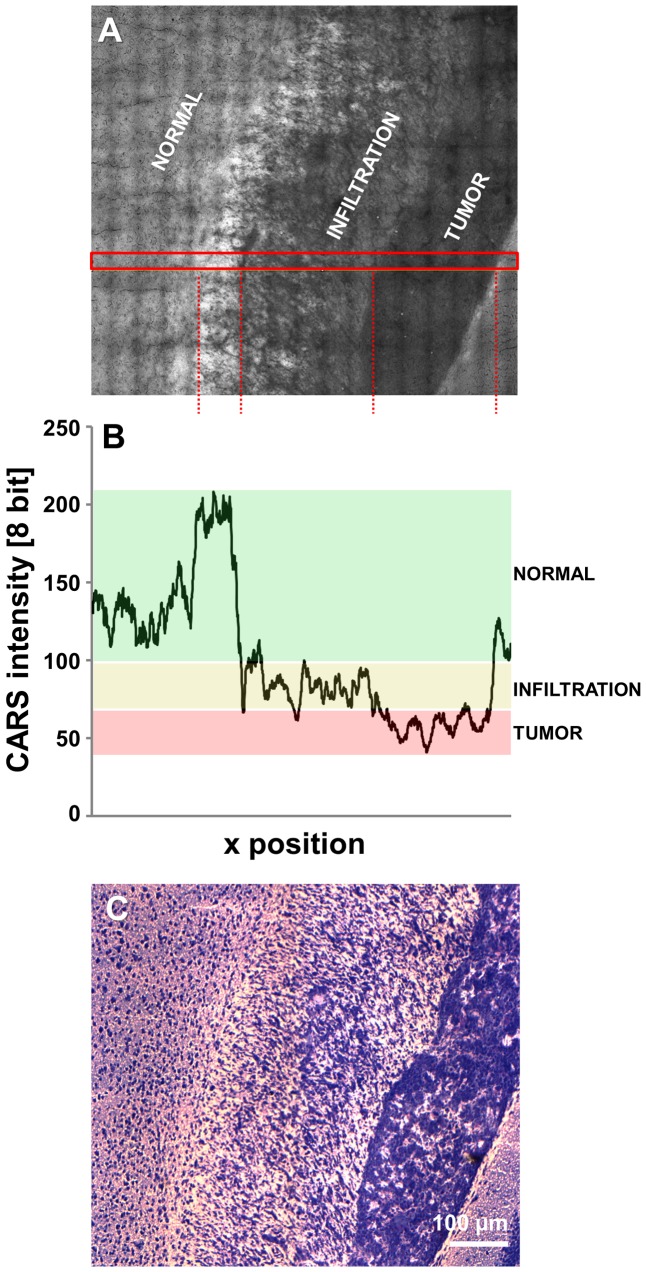
Figure 3. Quantification of the CARS signal intensity of infiltrative tumor areas.
A: Unprocessed CARS image of a human U87MG glioblastoma in a mouse brain, displaying a solid tumor and a large infiltrative region. B: CARS signal intensity along the area indicated in A. The CARS signal intensity range indicative of normal tissue is underlined in green, the intensity range indicative of infiltrative areas in yellow and the intensity range indicative of tumor in red. C: H&E staining corresponding to A.

