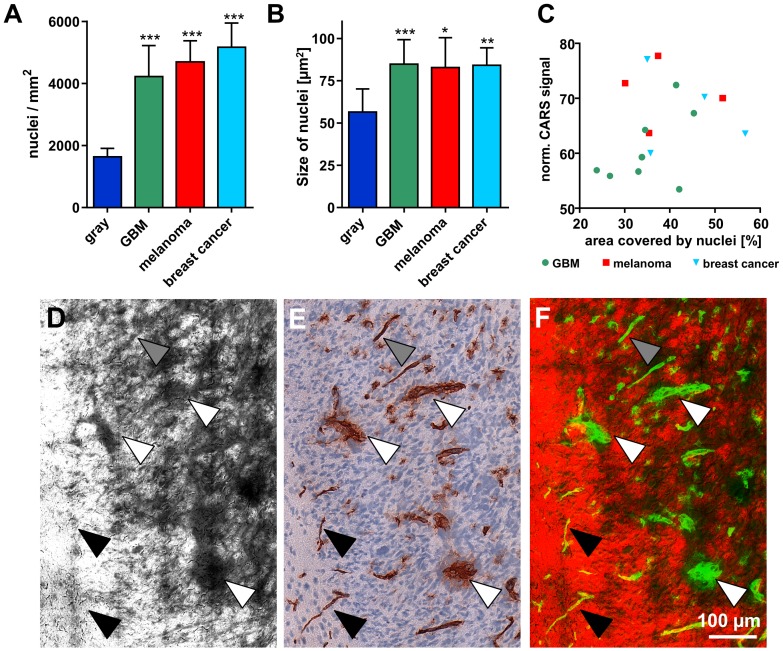
Figure 5. Tumor-induced changes influence the CARS signal intensity.
A/B: Number of nuclei/mm2 representing cellular density (A) and size of single nuclei (B) within normal gray matter and different experimental tumors in a mouse brain. Bars represent mean ± SD, GBM n = 8; melanoma metastases n = 4; breast cancer metastases n = 4; *** significant difference vs. normal gray matter: P<0.001. C: Dot plot showing the total area occupied by cell nuclei vs. the normalized CARS signal intensity of the respective tumor. D: CARS image of an experimental GBM induced in a mouse brain. E: Anti-CD31 staining of a consecutive section of the one shown in D. F: Overlay of CARS (red) and anti-CD31 (in false color: green). Coarse blood vessels (white arrowheads) and fine blood vessels (gray arrowheads) are detected in the CARS image. Very fine (normal) blood vessels do not cause any alterations of the CARS signal (black arrowheads).

