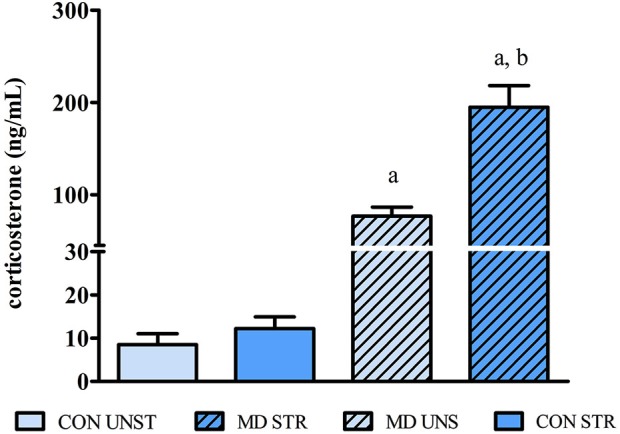
Figure 1.

CORT plasma levels on PND10 (24 h after maternal deprivation onset/2 h after saline injection) expressed as mean ± S.E.M. CON = group not maternally deprived; MD maternal deprivation on postnatal day 9. UNS = no stress challenge; STR = saline injection stress challenge. a = significantly different from respective CON; b = significantly different from respective UNS (n = 11–16/group).
