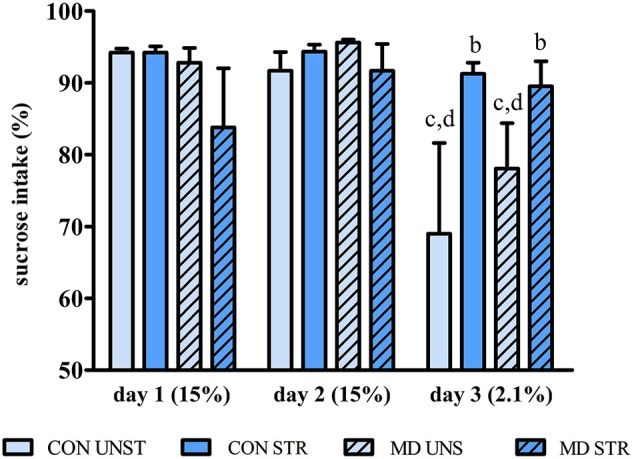
Figure 2.

Mean ± S.E.M. percentage of sucrose intake during the course of 3-day testing relative to total liquid intake in each day. CON = group not maternally deprived; MD maternal deprivation on postnatal day 9. UNS = no stress challenge; SAL = saline injection stress challenge. b = significantly different from respective UNS; c = significantly different from respective intake on day 1; d = significantly different from respective intake on day 2 (n = 8–10/group).
