Figure 4.

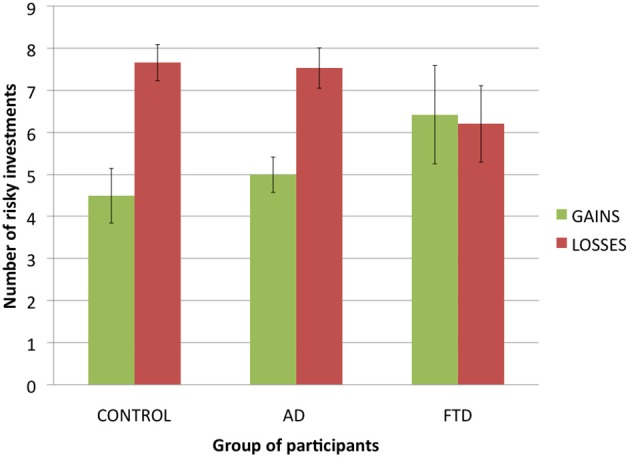
Satisfaction ratings in function of potential gains (+$2000 or −$2000) for each group of participants (error bars indicate standard error).

Satisfaction ratings in function of potential gains (+$2000 or −$2000) for each group of participants (error bars indicate standard error).