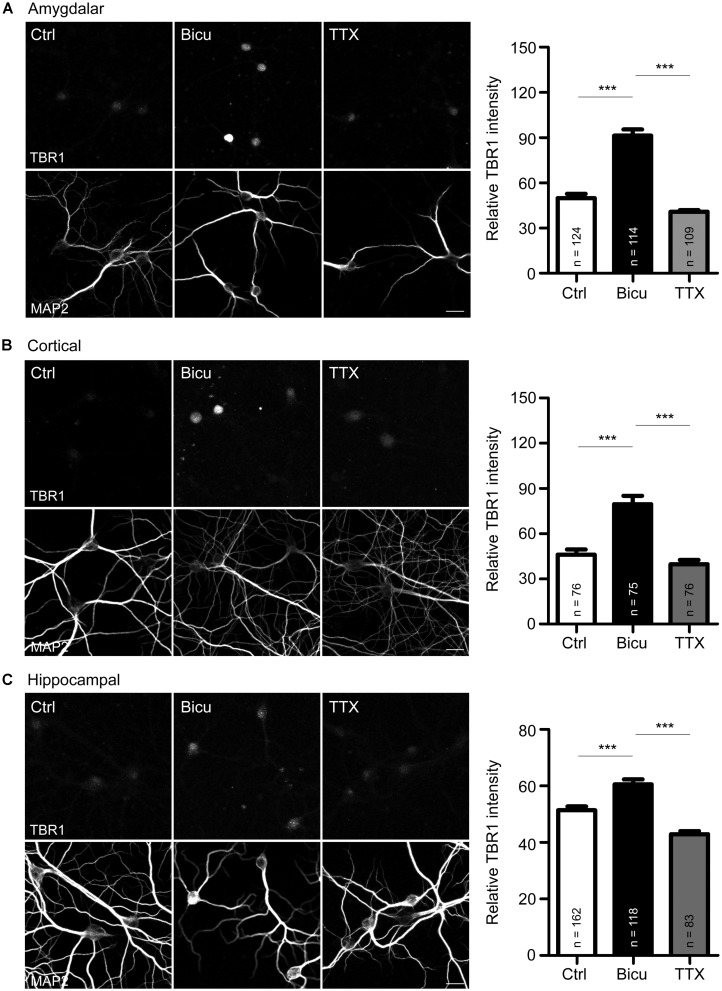
FIGURE 1.
T-brain-1 proteins are induced by neuronal activation in cultured neurons. (A–C) Double immunostaining with TBR1 and MAP2 antibodies. Primary amygdalar (A), cortical (B), and hippocampal (C) neurons were incubated with TTX (1 μM) or bicuculline (Bicu, 40 μM) for 6 h at 21 DIV. Neurons were then fixed for immunostaining. Scale bars: 20 μm. The bar graphs in right panels of (A–C) show the mean fluorescence intensity of TBR1 quantified by MetaMorph software. All data are presented as the mean + SEM. The number of neurons (n) analyzed for each experiment is indicated in the figure. ***P < 0.001.

