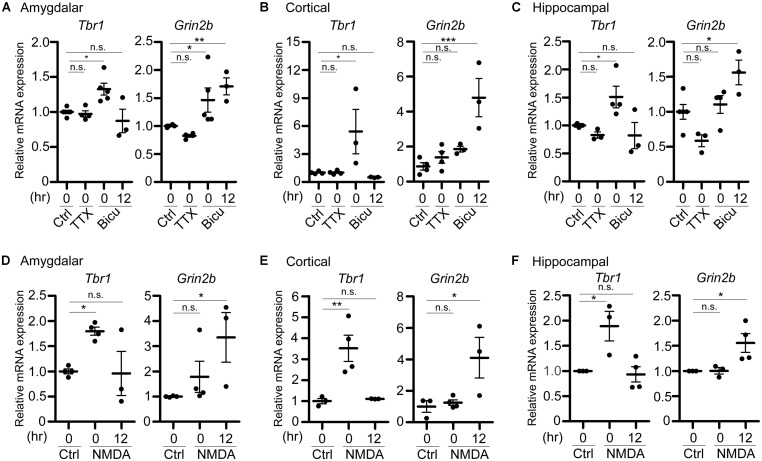
FIGURE 3.
Tbr1 upregulation correlates with Grin2b induction in cultured neurons. Quantitative-PCR analyses were performed to examine the expression of Tbr1 and Grin2b upon (A–C) TTX and bicuculline (Bicu) treatment and (D–F) NMDAR activation. Cultured amygdalar (A,D), cortical (B,E), and hippocampal (C,F) neurons were incubated with TTX (1 μM), bicuculline (40 μM), NMDA (10 μM), or vehicle (Ctrl) for 6 h. Immediately (0 h) or 12 more hours (12 h) after treatment, neurons were harvested for quantitative-PCR using Cyp as an internal control to quantify the relative mRNA levels of Tbr1 and Grin2b at 21 DIV. The experiments were performed independently at least three times. Data are presented as the mean ± SEM. *P < 0.05; **P < 0.001; ***P < 0.001; n.s., not significant.

