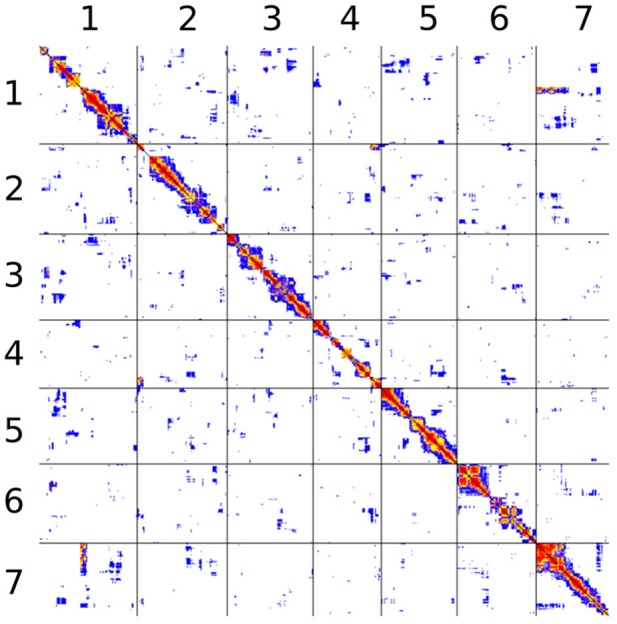
Figure 6.

Pairwise linkage disequilibrium between all markers belonging to assembly scaffolds 1 through 7. The figure does not account for physical distance. Black lines separate scaffolds. All pairs are represented twice, above and below the diagonal. Each pair is represented by a single pixel. The color code is based on Fisher's exact test P-value: red, P < 10−10; orange, P < 10−8; yellow, P < 10−6; purple, P < 10−4; blue, P < 10−2; white, larger P-values or not computed.
