
Figure 3.
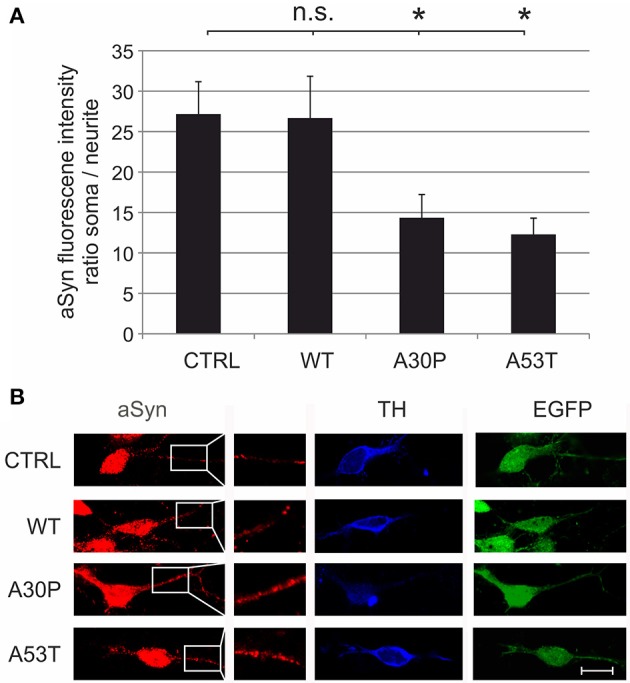
Subcellular distribution of aSyn fluorescence intensity in MDN transduced with aSyn WT and mutant forms. MDN transduced with AAV vectors expressing EGFP (CTRL) or the given aSyn forms (1 × 10⁸ transducing units/400,000 neurons/well) were immunostained against aSyn and TH. The fluorescence intensity of aSyn was quantified in the soma and in the neurite and the respective ratio was calculated (A). Bars represent means ± s.e.m. n.s. = not significant; *p < 0.05. (B) Representative confocal micrographs of AAV-transduced (EGFP-positive, green) dopaminergic (TH-positive, Cy5, blue) neurons stained against aSyn (Cy3, red). Scale bar = 30 μm.