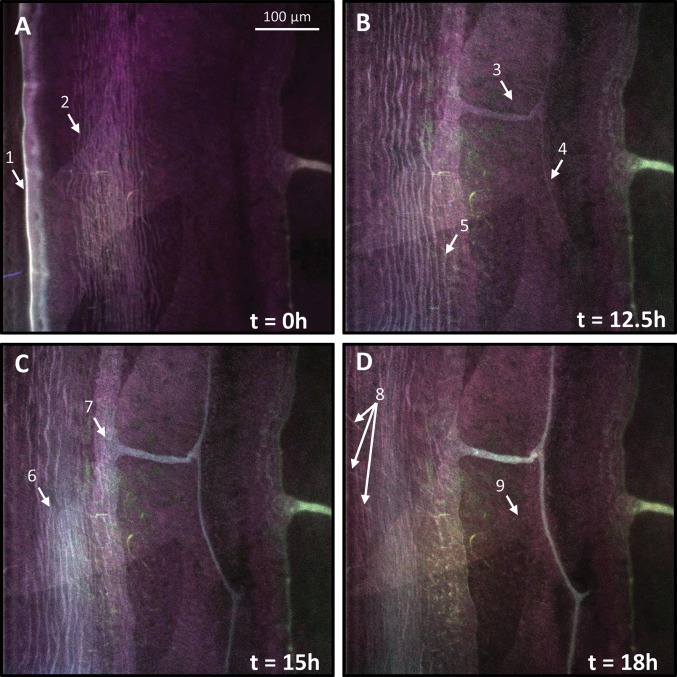
Figure 1.
Confocal microphotographs showing time series of spectrally accurate autofluorescence at the leading edge of A. amphitrite. (A) At t = 0, two prominent features are present: a bright band at the periphery (arrow 1) and circumferentially striated bands (arrow 2). (B) At t = 12.5 h, there is the appearance of autofluorescence within a new duct and capillary (arrows 3 and 4, respectively). Additionally, the innermost striated band has stopped advancing (arrow 5) relative to the leading edge. (C) By t = 15 h, a second set of striations appear (arrow 6) and the region surrounding the duct orifice shows autofluorescence matching the spectral signature within the duct/capillary (arrow 7). (D) At t = 18 h, dislocated fragments of the initial striated material are observed (arrow 8) as well as the presence of a weakly fluorescent granular-appearing wavefront that advanced toward the new capillary/duct boundary at a variable rate (arrow 9).

