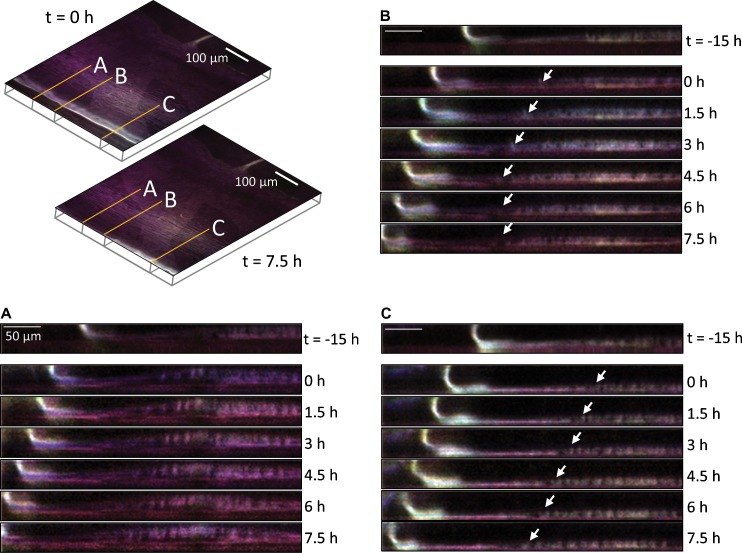
Figure 2.
Autofluorescent images highlighting lateral growth of the leading edge with respect to the striated layers. The upper left panel shows autofluorescence at two time points (t = 0 and 7.5 h) with three different locations over which fluorescence was tracked. Lines A, B, and C correspond to cross-sectional x,z planes of fluorescence in panels A, B, and C. Panel A: striated bands show clear separation from underlying fluorescence. Panel B: discontinuities in the striated layers (white arrows). Panel C: leading striated layer advances in synchrony with leading edge of barnacle (white arrows).

