
Table 4. Relative expression of selected genes involved in lipid and glucose metabolism in Zucker Diabetic Fatty rats after 8-week dietary intervention.
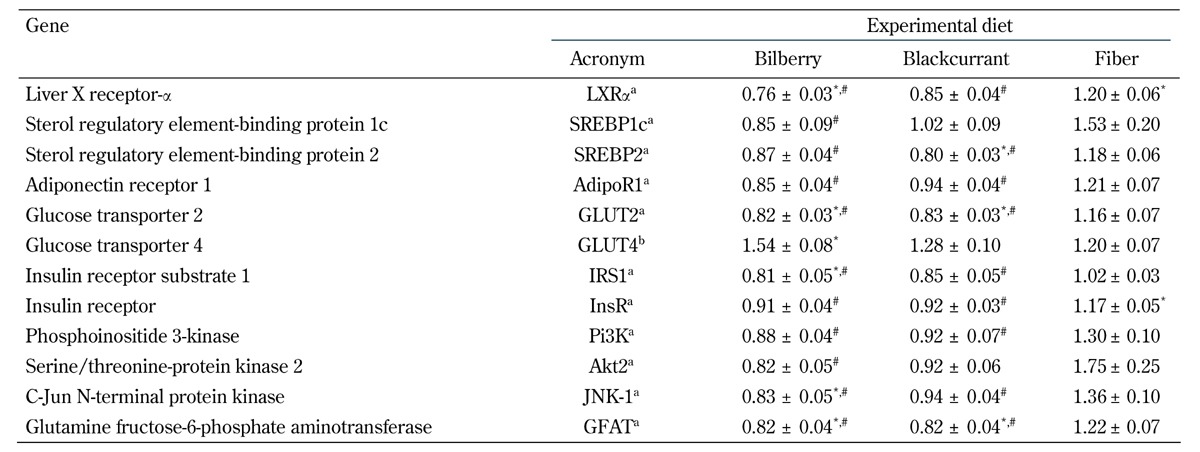
Legend: Data are means ± SEM, expressed relative to the control diet, n = 11-12/group. Quantitative RT-PCR was performed for the selected genes, and was normalized to the geometric mean of two endogenous controls (S18 and Hprt1). a Expressed in hepatic tissue. b Expressed in subcutaneous adipose tissue. * p < 0.05 vs. control diet, one-way ANOVA or Kruskal-Wallis' test. # p < .05 vs. fiber diet, one-way ANOVA or Kruskal-Wallis' test.