
Figure 2.
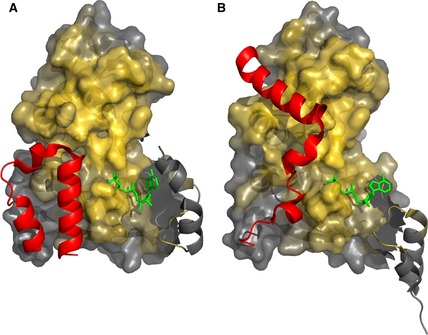
Heterogeneity of CFTR R region:NBD1 interactions. N‐terminus of the R region (red, residues 638–671) in different NBD1 crystal structures (A, 1R0X; B, 1XMI) oriented to show the NBD dimerization interface 15. The core NBD1 (surface representation) is colored as a gold gradient reflecting the proximity to atoms in the other NBD1 molecule within the NBD1:NBD1 homodimer structure (2PZE). The flexible regulatory insertion (RI) of NBD1 that is in different conformations in the two structures is shown as gray helices and is not part of the surface representation.