
Figure 3.
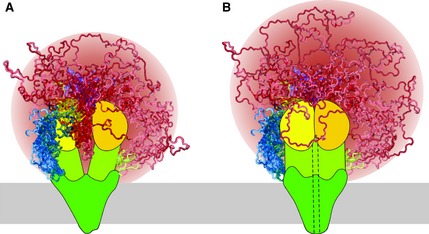
Schematic models of (A) non‐phosphorylated/closed channel and (B) PKA‐phosphorylated/open channel states of CFTR. Shown are the N‐terminal segment (blue), membrane‐spanning domains (dark green), the intracellular domains (yellow‐green), NBD1 (yellow), NBD2 (gold), R region (red) and the C‐terminal segment (purple). Disordered elements (N‐terminus, R region and C‐terminus) are shown as a superposition of multiple possible conformations. Helix 9 of NBD1 (residues 635–643, yellow) and the C‐terminal elbow helix (residues 842–855, green) are also not in a fixed position to demonstrate that they can sample multiple conformations and may be considered part of the R region. The dashed line (in B) schematically illustrates the open channel pore, the membrane is represented as a gray bar and the R region sampled space is colored as a gradient (red of various intensities). PKA phosphorylation sites are not marked. R region sampling in the two phosphorylation states is similar, although the phosphorylated R region samples space farther from the core of CFTR as it is excluded from the NBD interface.