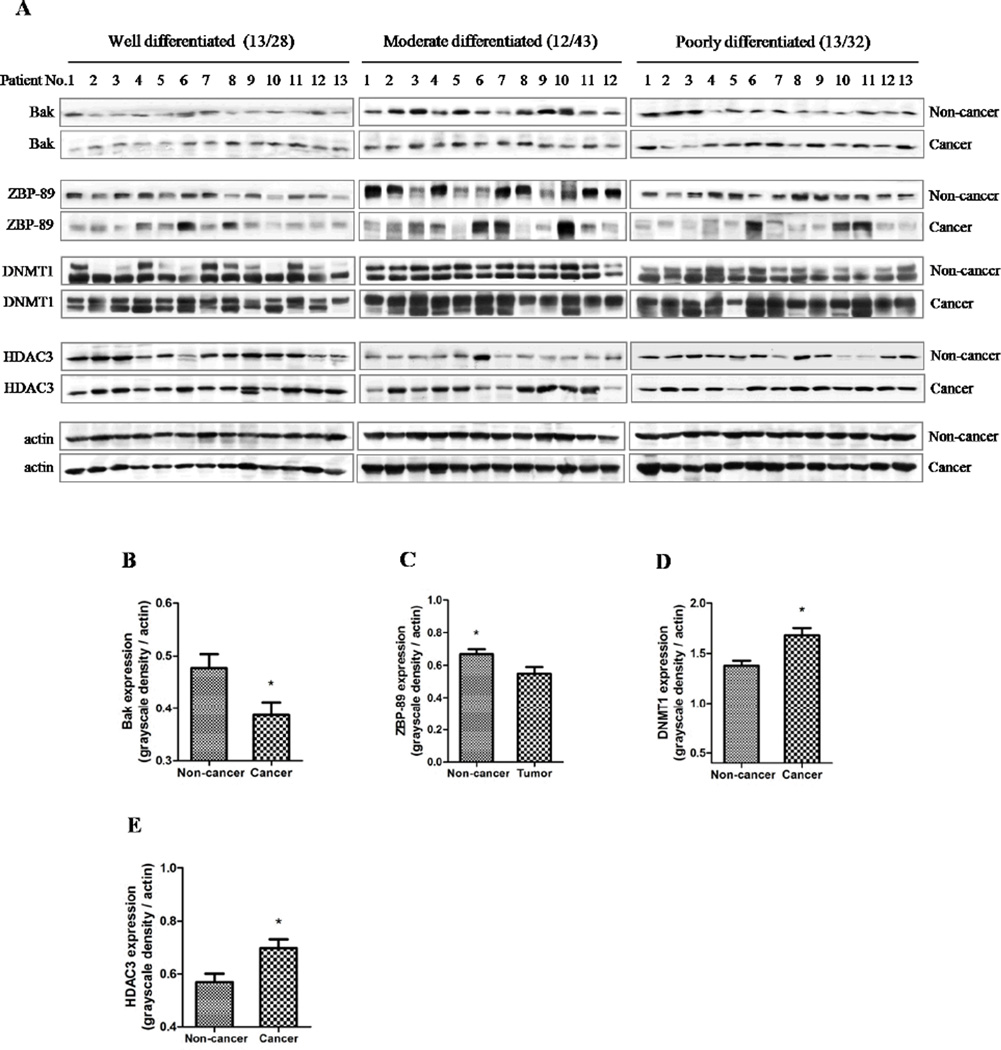
Fig. 2. Bak expression is strongly related to ZBP-89, DNMT1 and HDAC3 in HCC.
The expression of Bak, ZBP-89, DNMT1 and HDAC3 in different differentiated HCC samples was examined. The grayscale density of proteins bands was shown in a bar chart, according to different HCC differentiation subtypes. Bak, ZBP-89, DNMT1 and HDAC3 levels were significantly different between cancer tissues and their paired non-cancer tissues (B, C, D and E).

