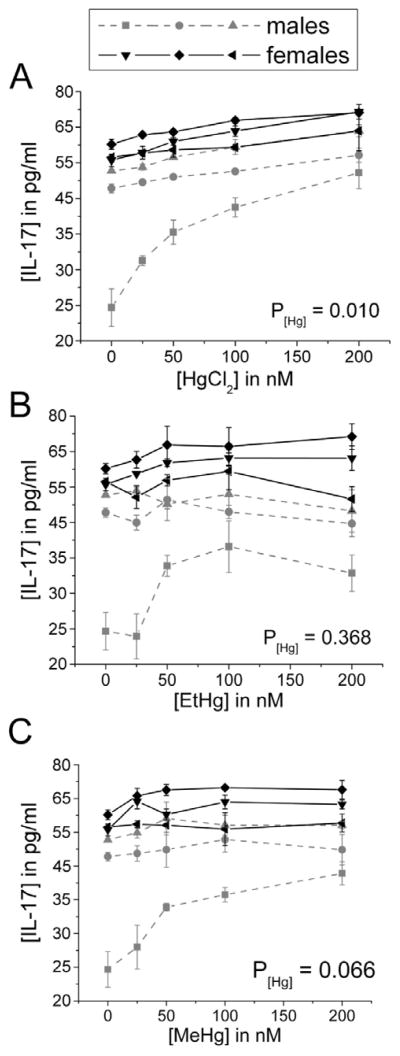
Figure 9. IL-17 release increases in a concentration-dependent manner in response to iHg treatment.
PBMCs isolated from six volunteers were treated with the specified concentrations of each mercury species (up to 200 nM) in the presence of 50 ng/ml LPS. IL-17 was measured in cell culture supernatants after 24 hours in culture. Results are shown for cells treated with iHg (A), EtHg (B), and MeHg (C). P[Hg] represents the p-value for the trend in Hg effect in the concentration-response curve. Error bars represent the standard error of the mean.

