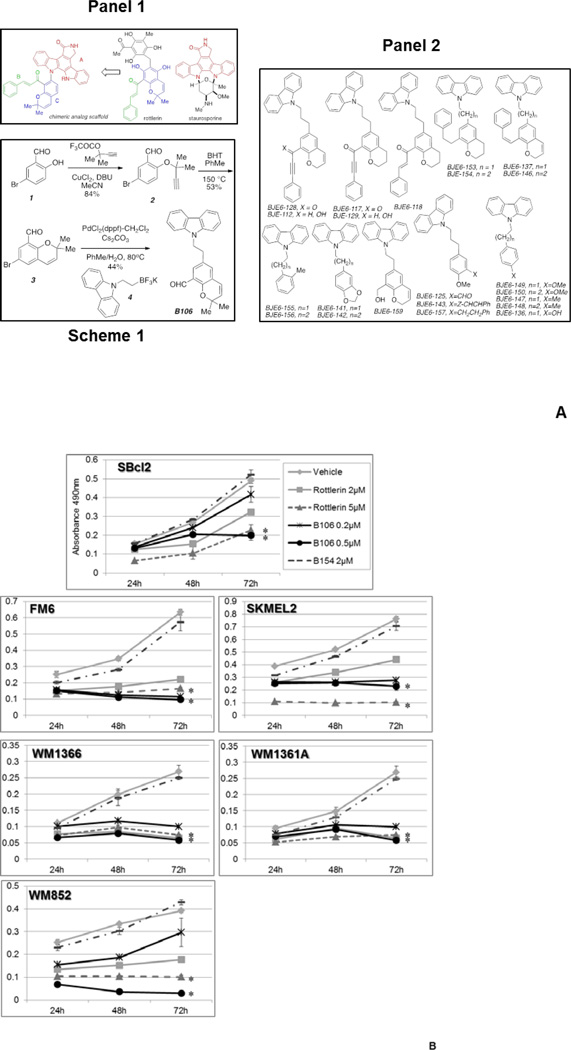
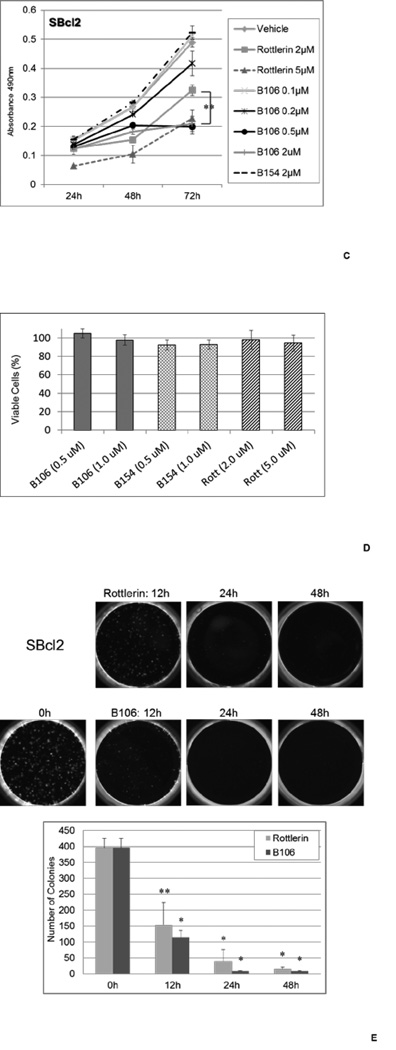
Figure 2. PKCδ inhibitors suppress survival in melanoma cell lines with NRAS mutations.
(A) Structure and synthesis of PKCδ inhibitors. Panel 1: Design of mallotoxin/rottlerin-staurosporine hybrids; Scheme 1: Synthesis of B106; Panel 2: 3rd Generation Compounds
(B) PKCδ inhibitors suppress cell survival in melanoma cell lines with NRAS mutations. SBcl2, FM6, SKMEL2, WM1366, WM1361A and WM852 cells were exposed to rottlerin (2 or 5 µM) or B106 (0.2 or 0.5 µM) for 24, 48 or 72 hr and MTS assays were performed at each time point. DMSO and B154 (2 µM) served as a vehicle control and a negative compound control, respectively. Each point represents the average of triplicates and error bars indicate the standard deviations. P values (*) were calculated between DMSO (vehicle control) and rottlerin 5 µM, or DMSO and B106 0.5 µM in each cell line at 72 hr (p < 0.0002).
(C) Titration of PKCδ inhibitor treatment. The expanded doses of B106 (0.1 µM and 2 µM) in the MTS assay in SBcl2 in Figure 2A are shown. ** indicates a p value < 0.5 between treatment of 2 µM of rottlerin and B106.
(D) Effects of PKCδ inhibitors on primary human melanocytes. Cell survival of human primary melanocytes exposed to the indicated concentrations of the compounds for 72 h (relative to DMSO-treated controls; mean ± SD, n = 3).
(E) PKCδ inhibitors induce irreversible effects on cell growth. SBcl2 cells were treated with rottlerin or B106 at 1 µM for 0, 12, 24 or 48 hr. After these exposure times, the same number of viable cells from each treatment condition was replated at low cell density and cells were cultured in medium without inhibitors for 8 days. Cell colonies were counted. Each point represents the average of triplicates and error bars indicate the standard deviations. P values: ** p<0.01, * p<0.001 compared to time 0 hr.


