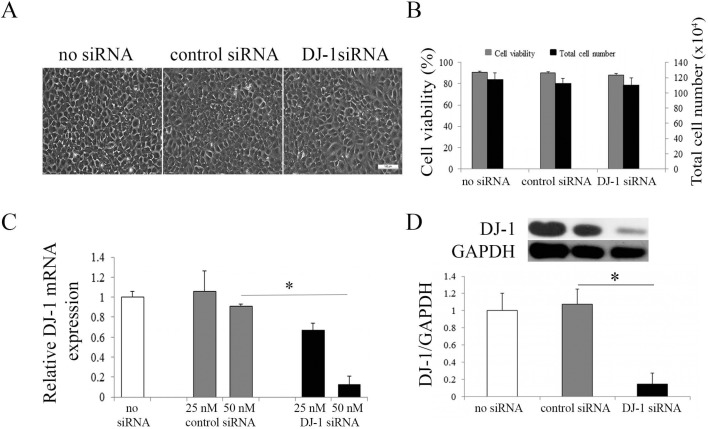
Figure 1.
Knockdown of DJ-1 in HCECi cells. (A) Representative phase-contrast microcopy images of HCECi transfected with DJ-1 siRNA. Three days post DJ-1 transfection, HCECi cells showed the normal endothelial cell morphology seen in non–siRNA- and control siRNA-treated cells. Scale bar: 100 μm. (B) Trypan blue assay showed similar cell survival and similar total cell numbers in DJ-1 siRNA and control treatments. (C) Real-time RT-PCR analysis of DJ-1 mRNA levels in non–siRNA-treated, control siRNA-treated, and DJ-1 siRNA-treated HCECi cells with 25 nM or 50 nM siRNA transfection. Results were expressed as fold-changes and normalized to β2-microglobulin. Data showed DJ-1 mRNA levels were significantly decreased in 50 nM DJ-1 siRNA-treated HCECi cells as compared to controls. (D) Representative Western blot (upper panel) of DJ-1 protein levels in non–siRNA-treated, control siRNA-treated, and DJ-1 siRNA-treated HCECi cells with 50 nM siRNA transfection. Averaged densitometric analysis (lower panel) showed that DJ-1 protein levels were significantly reduced in DJ-1 siRNA-treated HCECi cells as compared to controls. GAPDH was used for normalization of protein loading. *P < 0.05.

