Fig. 5.

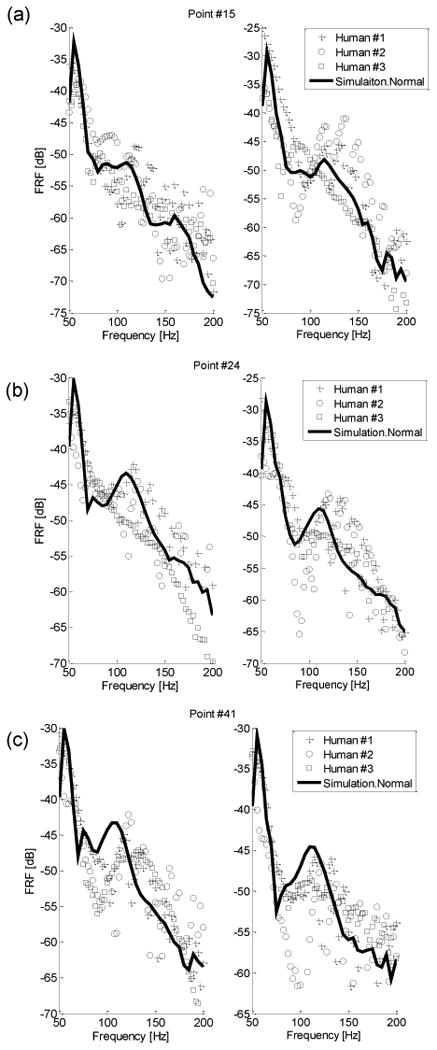
FRF plots at point #15(a), #24(b), and #41(c) on posterior chest (left/right sides correspond to left/right columns). Key: ‘−’ simulation FRF, ‘+’ HS #1 experiment, “(○)” HS #2 experiment, ‘(□)’ HS#3 experiment.

FRF plots at point #15(a), #24(b), and #41(c) on posterior chest (left/right sides correspond to left/right columns). Key: ‘−’ simulation FRF, ‘+’ HS #1 experiment, “(○)” HS #2 experiment, ‘(□)’ HS#3 experiment.