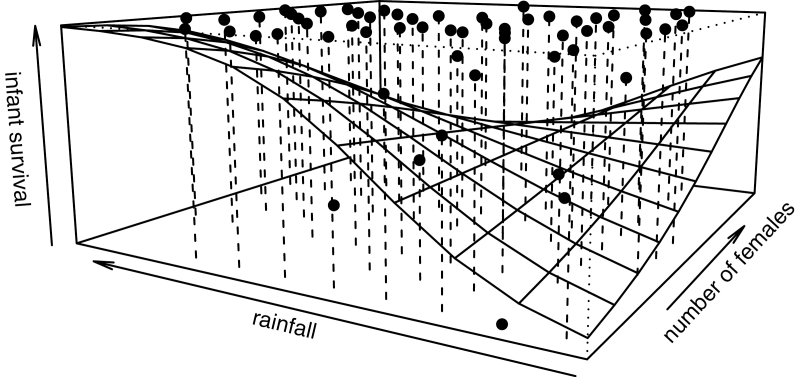
Figure 2.
Effect of rainfall and number of group adult females on the likelihood of infant survival. The plane depicts values predicted by the infant Cox mixed model with each grid representing the mean value per square of the predicted mixed model. Dots represent mean empirical survival rates per square.

