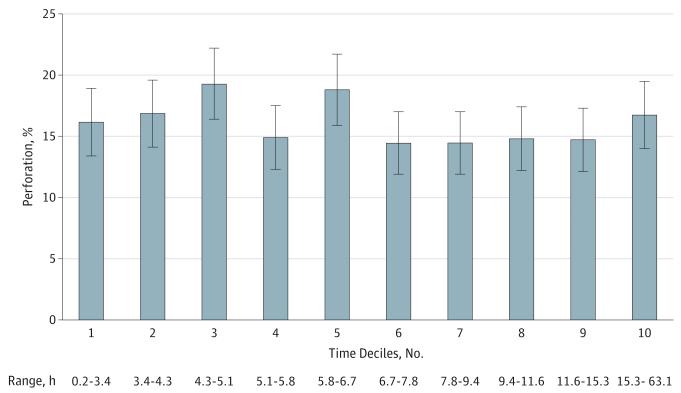
Figure. Percentage of Perforation by Deciles of Time From Presentation to Operating Room Start.
Patients were ordered by time to treatment and divided into deciles. Percentage of perforation and 95% CIs were calculated for each decile. The range of elapsed time from hospital presentation to operating room start time is shown for each decile (ie, the shortest time and the longest time for each decile).

