Figure 5.

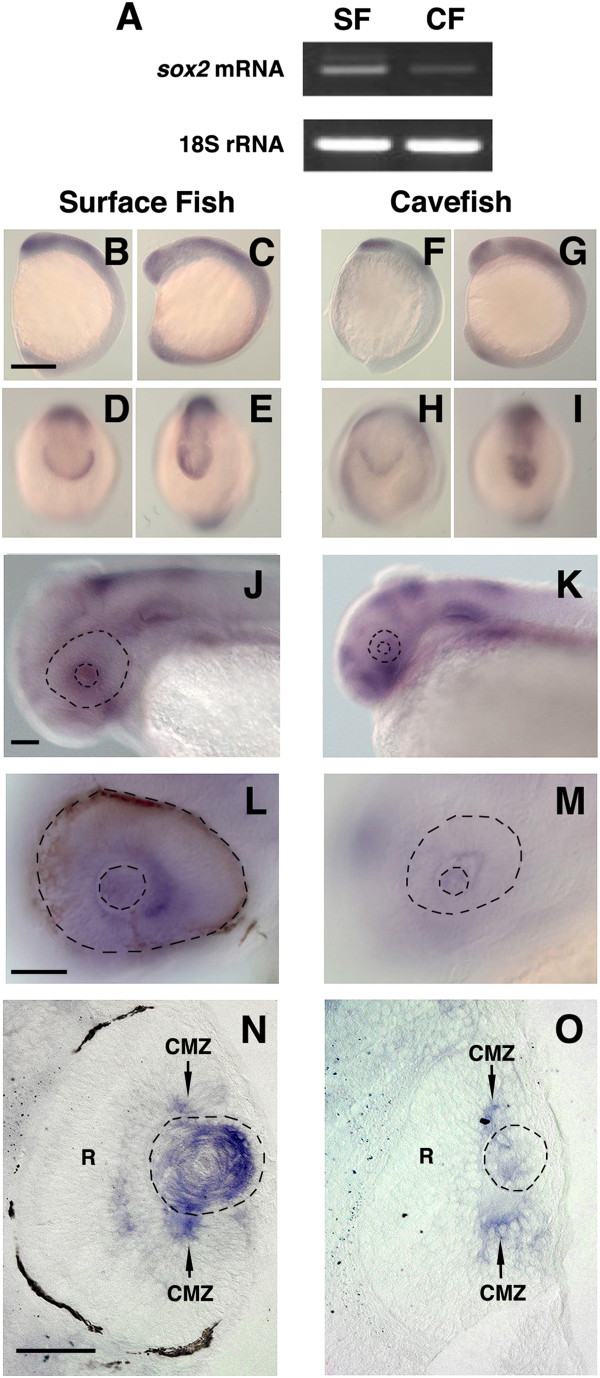
sox2 expression is downregulated in the lens during cavefish development. (A) Semiquantitative RT-PCR showing reduced sox2 mRNA levels in cavefish relative to surface fish embryos. (B-O)In situ hybridization shows sox2 expression during surface fish (B-E, J, L, N) and cavefish (F-I, K, M, O) development. B-I Tailbud (B, D, F, H) and 5-somite (C, E, G, I) stages viewed from the lateral (B, C, F, G) or rostral (D, E, H, I) sides. Scale bar in B is 250 μm; magnification is the same in B-I. (J-O)sox2 downregulation in the cavefish lens at 42 hr post fertilization (hpf). N and O are sections through the eye region of the embryos shown in J-M. Dashed lines indicate the eye and lens. R: retina. CMZ: ciliary marginal zone. Scale bar in J, L and N is 100 μm; magnification is the same in J, K; L, M; and N, O.
