
Fig. 4.
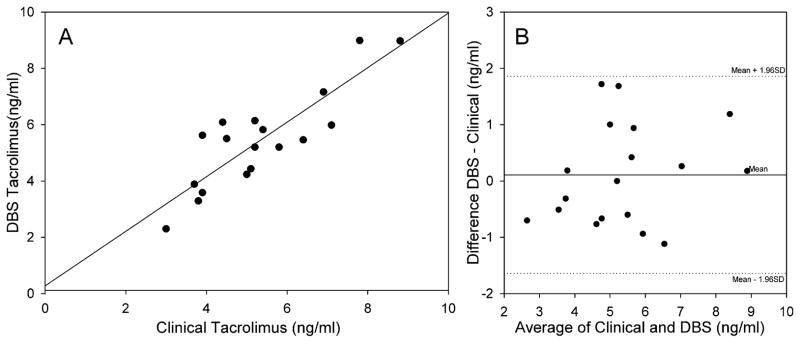
Comparison of the TAC concentration determined from DBS using the method outlined in the text with the values obtained from the clinical laboratory using radioimmunoassay. The correlation coefficient (R2) was 0.742, P < 0.001 with a slope of 0.969 and an intercept of 0.272 (N = 18).
Panel B: Bland–Altman relation showing the difference in TAC concentrations for the data plotted in Panel A. The central horizontal line represents the mean difference or bias. The two other lines represent the expected distribution of 95% of the measured points as determined by the combined total variation of each individual method.