
Fig 5.
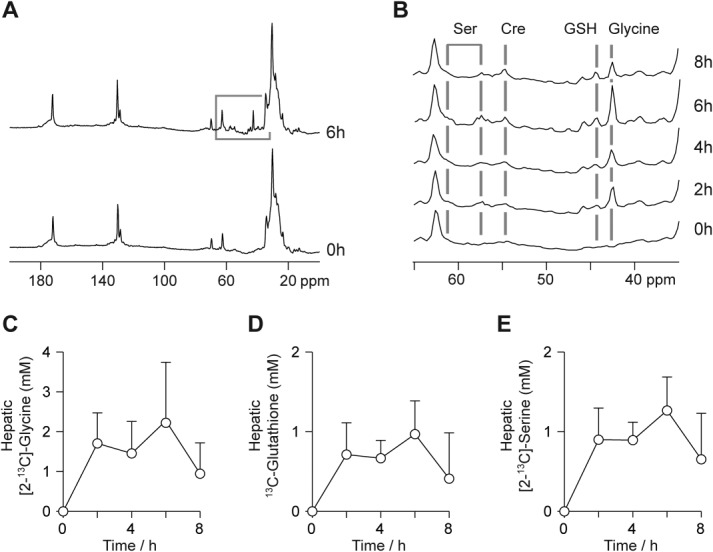
Human study 13C MR data. (A) Hepatic 13C spectra from a study volunteer before and after the 6-hour glycine ingestion period. (B) Region of the 13C spectrum from a study volunteer showing resonances from [2-13C]-glycine and endogenously 13C-labeled GSH, serine, and creatine. (C-E) Mean concentrations of [2-13C]-glycine, 13C-labeled GSH, and [2-13C]-serine over the experimental time course.