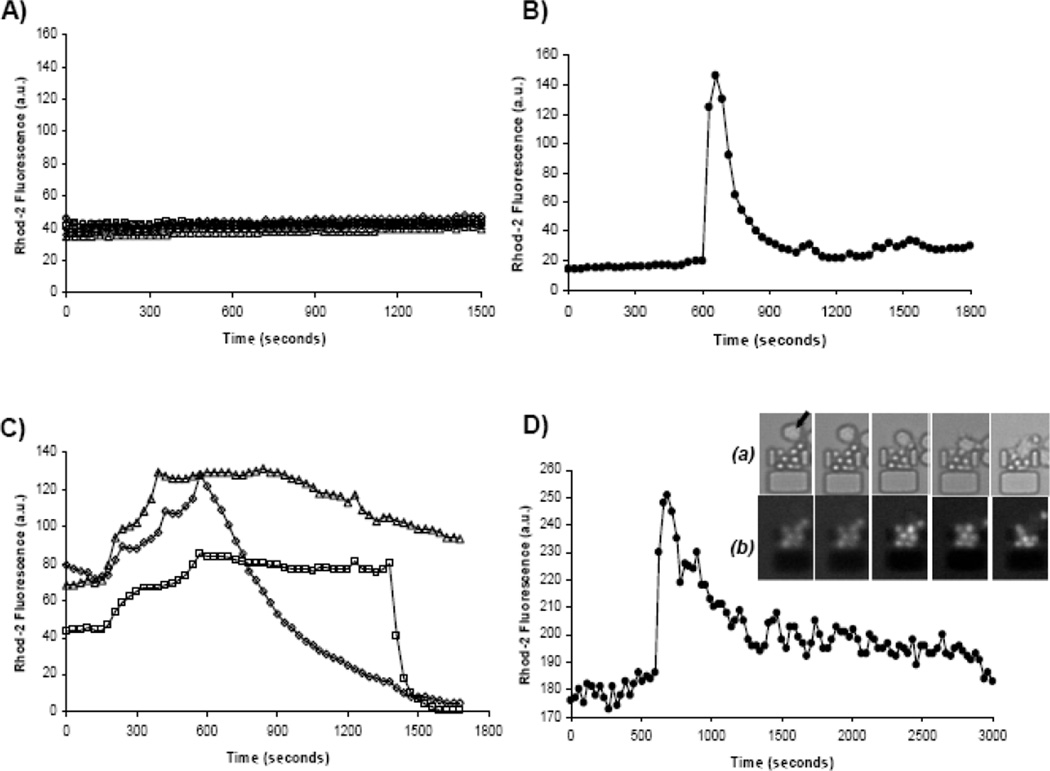
Figure 3.
Examples of cytosolic calcium transients, as indicated via rhod-2 calcium dye, in single primary T cells exposed to (A) plain media, (B) antibody-coated microspheres, (C) ionomycin, and (D) mature, stimulated dendritic cells. Each trace represents a single cell. Three traces are shown in (C) to illustrate the three typical calcium transient patterns observed when stimulating T cells with ionomycin. Inset relative to graph D shows example of (a) naïve T cells and mature dendritic cells (indicated in first frame by arrow) interacting within a single trap. The corresponding fluorescence images are shown in (b) as the cellular interactions stimulate calcium fluxes in TN cells (pre-loaded with rhod-2 calcium indicator).

