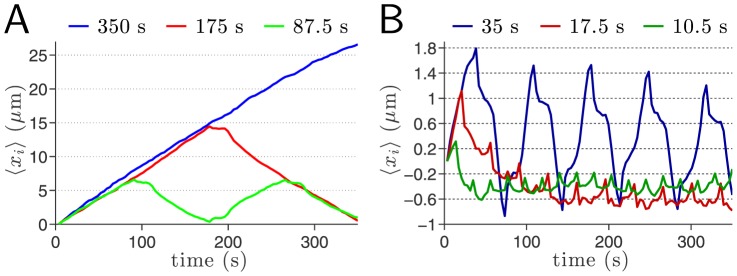
Figure 6. Cell Kinematics: Average displacement along the signal direction for different flow reversal frequencies.

Note the difference in scales on the  -axis for both graphs (Fig. S3). (A) For frequencies smaller than 0.01 Hz, on average the cells clearly undergo a uniform translational migration. When the flow direction is reversed, almost immediately the cells stop moving and it takes approximately 20 s before a motion in the opposite direction is measured. (B) For the frequencies
  Hz and
  Hz, the cells are still able to follow the faster reversals of signal directions but no longer in a uniform way (i.e. at constant speed). For the even higher frequency
  Hz, some changes in the cells' migration direction are discernible but the displacements with respect to the
  baseline are extremely small: cells are effectively trapped.
