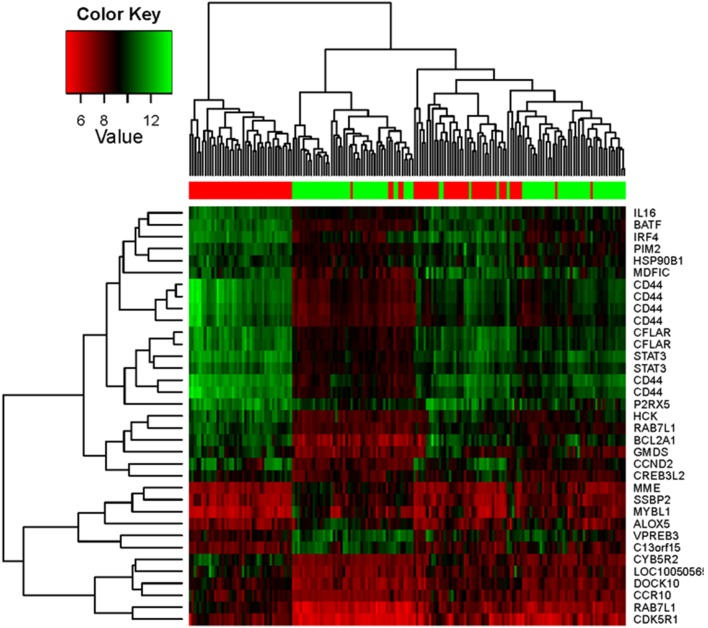
Figure 3. IRF4-associated gene expression pattern in lymphomas.
The GEO dataset GSE4475 which includes 220 BL and DLBCL samples [50], was subjected to bioinformatic analysis for differential gene expression pattern correlated with IRF4 and gene set enrichment, as detailed in Materials and Methods. The heat map shows results from analysis with cut-off p value<0.01 and fold change≥2.

