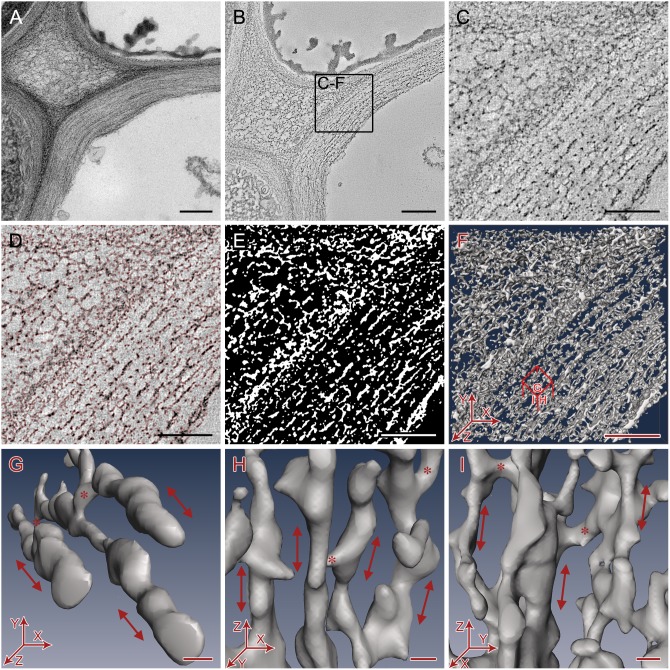
Figure 3. The electron tomography data collection and segmentation process used on Arabidopsis primary cell walls randomly chosen from chemically fixed samples.
A. 2D projection image of cell wall. B. Slice of reconstructed tomogram. Bars = 250 nm. C. Sub-area of tomogram. D. Electron dense cell wall components selected by thresholding (selected areas outlined in red). E. Segmentation map of thresholded cell wall components (white). F. Mesh surface rendering of threshold segmentation map. Bars = 100nm. G-I. Small representative 3D volumes of the segmented cell wall showing orientation of filamentous cellulose microfibrils (arrow) and hemicellulose cross-connections (*). G- Top view showing microfibrils running approximately along the axis of cell elongation (Z-axis). H- Side view showing a single layer of microfibrils. I - Side view showing neighboring layers of microfibrils. Bars = 5 nm.

