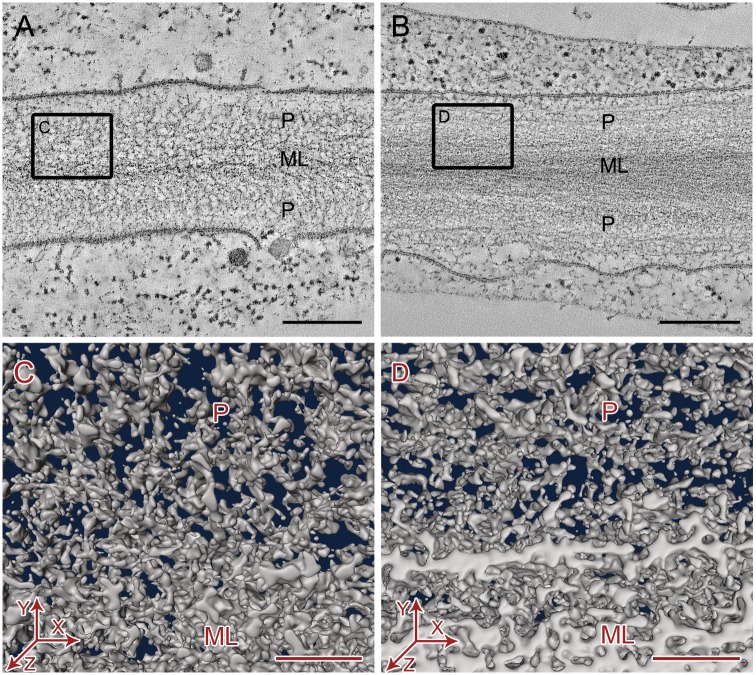
Figure 6. Qualitative comparison of primary cell wall ultrastructure in electron tomograms of high pressure frozen, freeze-substituted wild type hypocotyl parenchyma cells of wild type Arabidopsis (A, C) and cob-6 mutant (B, D).
A–B. Slices of electron tomogram showing overview of cell wall ultrastructure in 2D. Bars = 250 nm. C–D. Small volumes of segmented cell wall tomograms showing organization of cell wall components from top view (XY plane). Bars = 50 nm. ML = Middle lamella, P = Primary cell wall.

