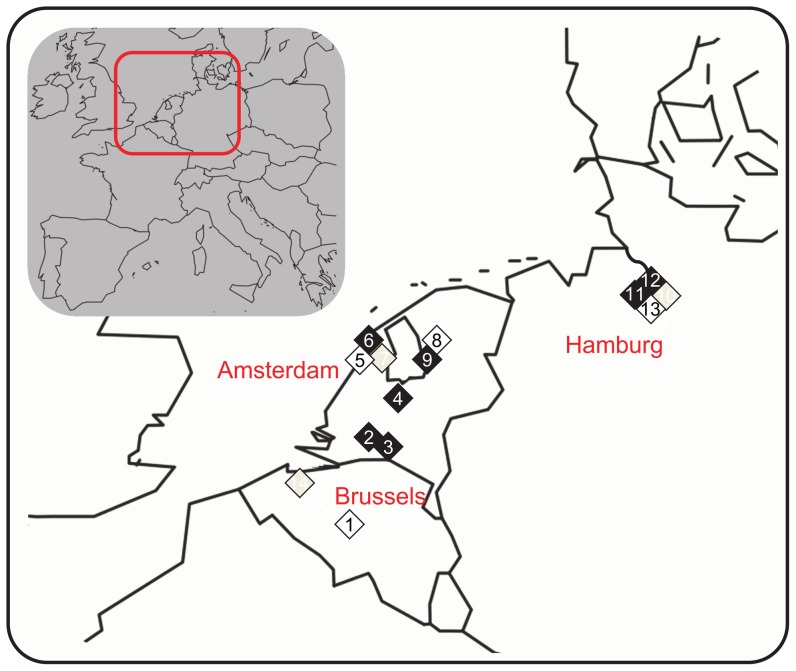
Figure 1. Location of 14 L. stagnalis populations involved in Q ST-F ST comparisons.
Populations are coded from 1 to 14. Colours indicate environmental categories (white, grey, and black, for GEP, GEP1, and GEP2, respectively). See Table 1 for details.

