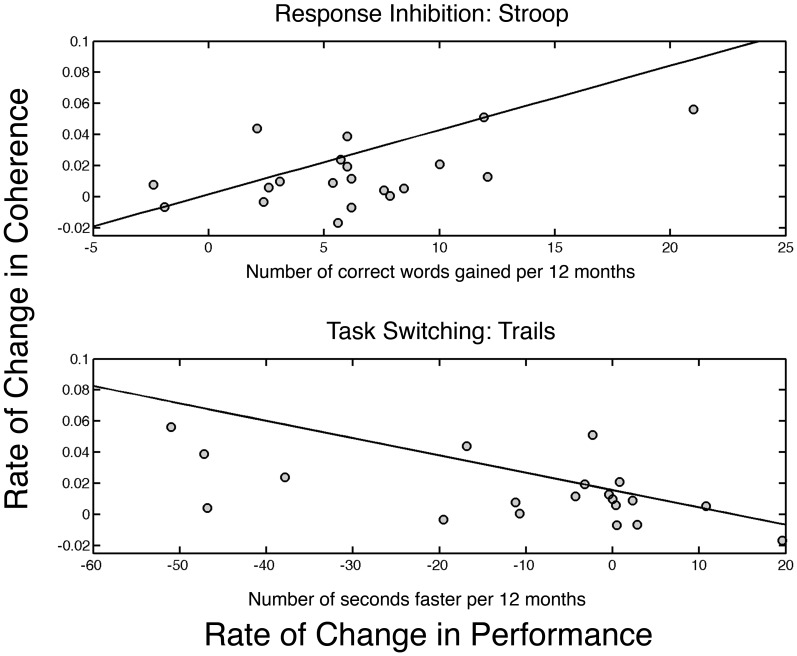
Figure 2. Rate of change in performance per year is plotted on the x-axis, while rate of change in intra-hemispheric sigma band coherence per year is plotted on the y-axis.
The top plot shows the results for the Stroop task in which the number of words correctly identified in the incongruent condition increases with age. The bottom shows the rate of change in the Trails task in which the time to completion is measured. The line represents the robust fit to the data. Thus, improved performance is indicated by a larger value for the Stroop and smaller value for the Trails. Lines represent robust regression fit to the data.

