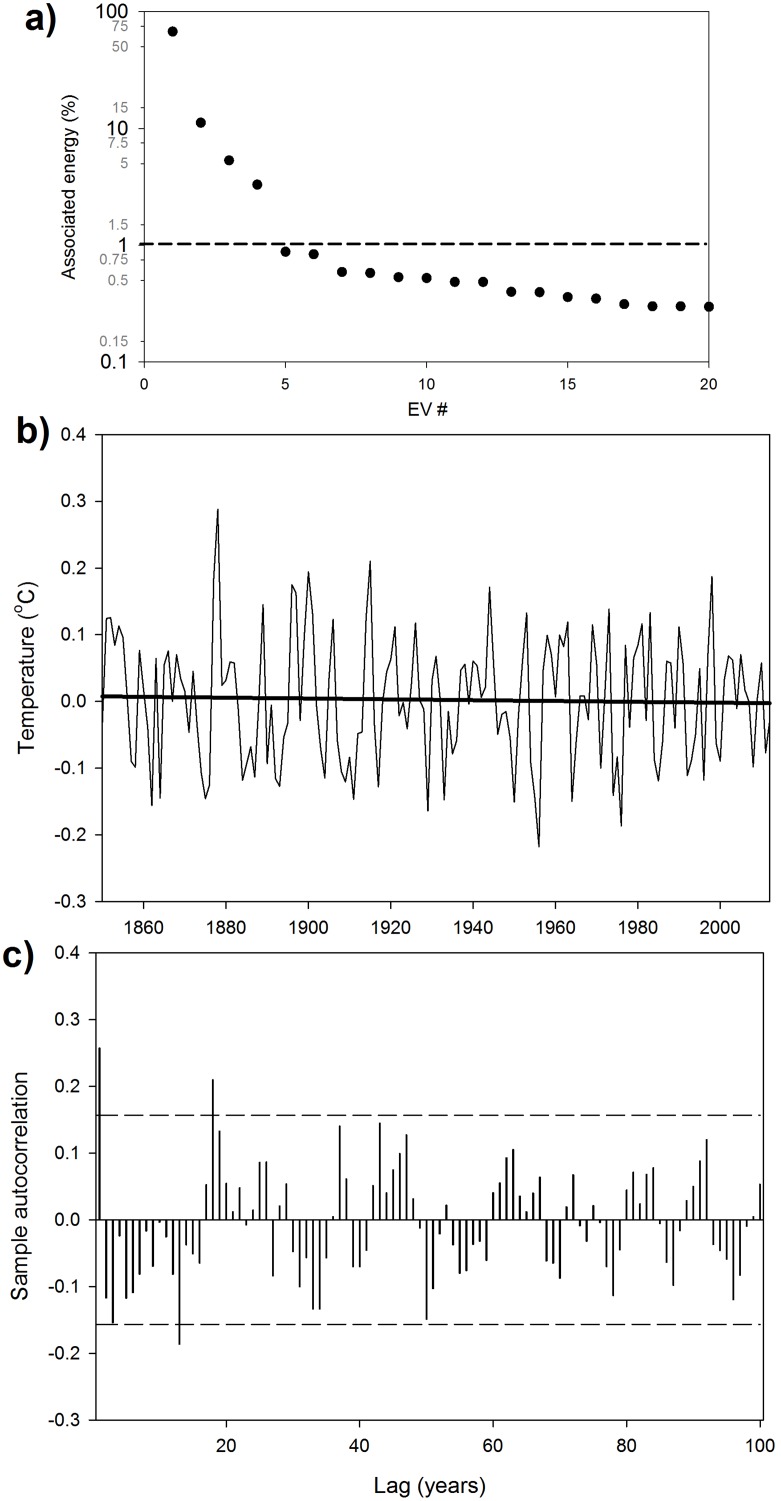
Figure 2. Singular spectrum analysis of the GMTA.
a) Energy diagram of the first 20 eigenvectors (EV) obtained from the SSA. The horizontal dashed line indicates the 1% energy limit. b) Residuals obtained by removing the signals associated with the first four EV from the original GMTA record. The black bold line represents the linear fit (not significant, p>0.05). c) Autocorrelation analysis of the residuals. The horizontal dashed lines indicate significant bounds.

