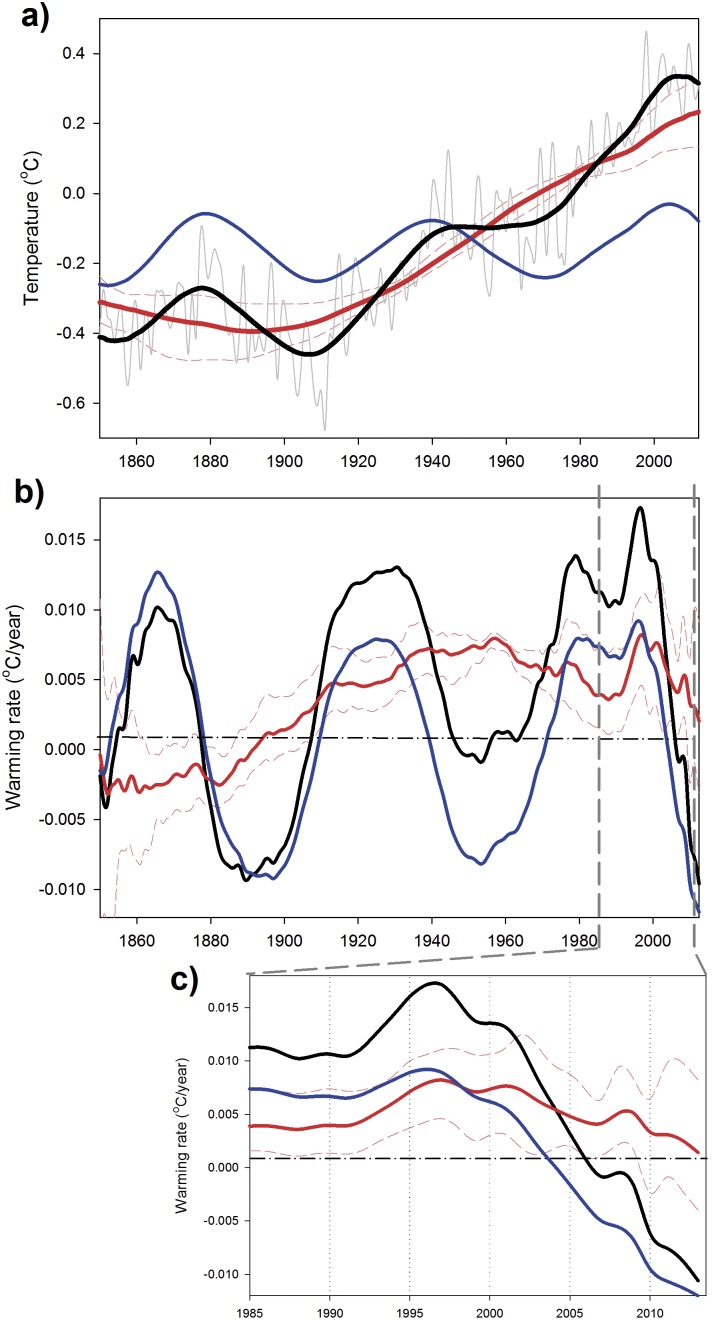
Figure 5. SSA reconstructed signals for Southern Hemisphere surface temperature.
a) HadCRUT4 annual surface temperature (gray line), multidecadal variability (MDV, blue line), secular trend (ST, red line) and reconstructed signal (MDV+ST, black line). The dashed thin red lines indicate the range of variability of the ST obtained by applying SSA to the temperature time series obtained for each individual month. b) Warming rates (°C year−1) obtained from the different signals identified in the SSA for the Southern Hemisphere. The dashed thin red lines are the confidence intervals for the warming rate associated with the ST obtained from each individual month’s time series. c) Zoom on the last 25 years of the warming rate time series.

