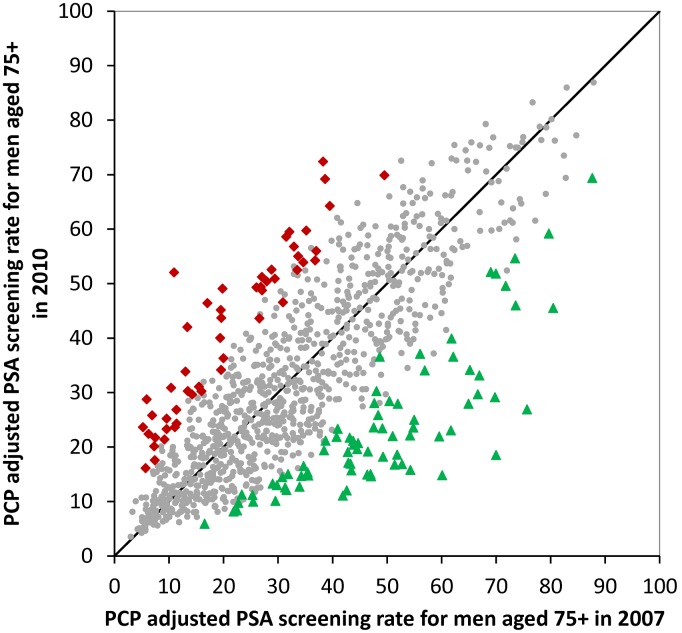
Figure 2. Scatterplot of the adjusted prostate specific antigen (PSA) screening rates in men 75+ for 1,083 PCPs in 2007 vs. 2010.
The 51 PCPs with significantly higher rates in 2010 are indicated with red, while the 77 PCPs with significantly lower rates are in green. The results were generated from a multilevel model adjusting for patient characteristics and including both the 2007 and 2010 data in the same model.

