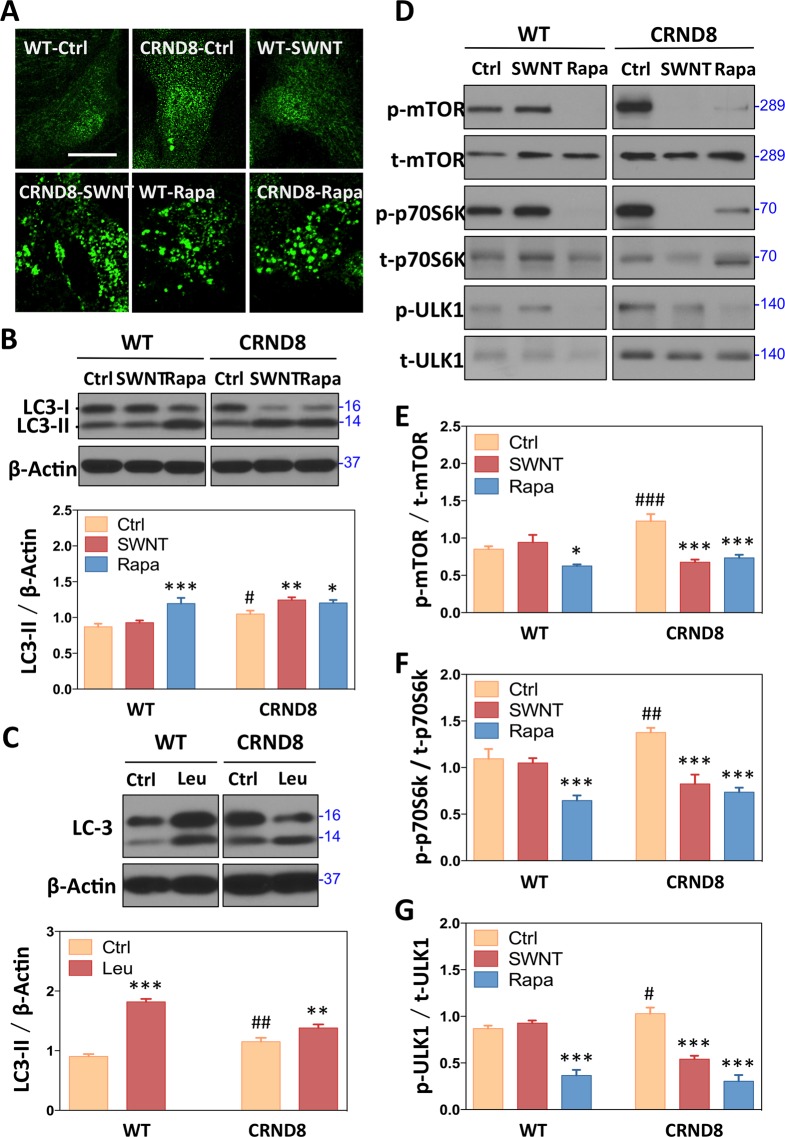
Figure 2.
Effects of SWNT on autophagic induction. (A) Formation of LC3-positive vesicular “puncta” (autophagosomes) in CRND8 glial cells treated with SWNT and rapamycin detected by immunofluorescence using LC3 antibody. (B) Western blot analysis showing LC3 levels with rapamycin (5 nM, 24 h) as a positive control and actin as a loading control. *p < 0.05, **p < 0.01, ***p < 0.001 versus CRND8 control group (CTRD8-Ctrl); #p < 0.05, ##p < 0.01, ###p < 0.001 versus the WT-Ctrl group; n = 3. (C) Western blot analysis of LC3-II levels in the absence and presence of leupeptin, a cysteine protease inhibitor, which blocks lysosomal degradation of LC3-II. The difference in LC-II levels under these two conditions is a measure of autophagosome formation.42 Data are presented as means ± SD *p < 0.05, **p < 0.01, ***p < 0.001 versus CRND8 control group (CTRD8-Ctrl); #p < 0.05, ##p < 0.01, ###p < 0.001 versus the WT-Ctrl group; n = 3. (D) Autophagic flux detection showing by Western blots with antiphospho-mTOR (p-mTOR), antitotal-mTOR (t-mTOR), antiphospho-p70S6k (p-p70S6k), antitotal-p70S6k (t-p70S6k),antiphospho-ULK1 (p-ULK1), and antitotal-ULK1 (t-ULK1) antibodies after treatment with SWNT 10 h following fresh medium instead for 14 h and rapamycin for 24 h. The ratio of p-mTOR/t-mTOR (E), p-p70S6k/t-p70S6k (F), p-ULK1/t-ULK1 (G) are quantified. Data are presented as means ± SD *p < 0.05, **p < 0.01, ***p < 0.001 versus CRND8 control group (CTRD8-Ctrl); #p < 0.05, ##p < 0.01, ###p < 0.001 versus the WT-Ctrl group; n = 3.

