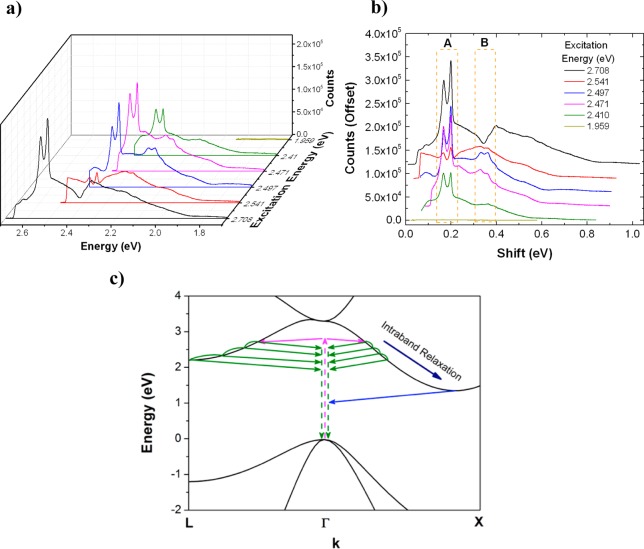
Figure 2.
Photoluminescence spectrum of plasmonically coupled silicon nanowire (d = 150 nm) plotted versus (a) absolute emission energy and (b) energy shift from the laser line for various excitation energies in the range 1.959–2.708 eV. Spectra in (b) are plotted with a constant offset of 2 × 10³ counts for clarity. The dashed boxes labeled A and B denote high-intensity emission bands. (c) Schematic of the electronic dispersion of silicon featuring carrier excitation (magenta arrows), intraband relaxation and hot luminescence (green arrows), and radiative recombination from thermalized carriers (blue arrows). This process is examined for relaxation toward the selected conduction band minima at both the X-points (1.12 eV) and L-points (∼2.1 eV).

