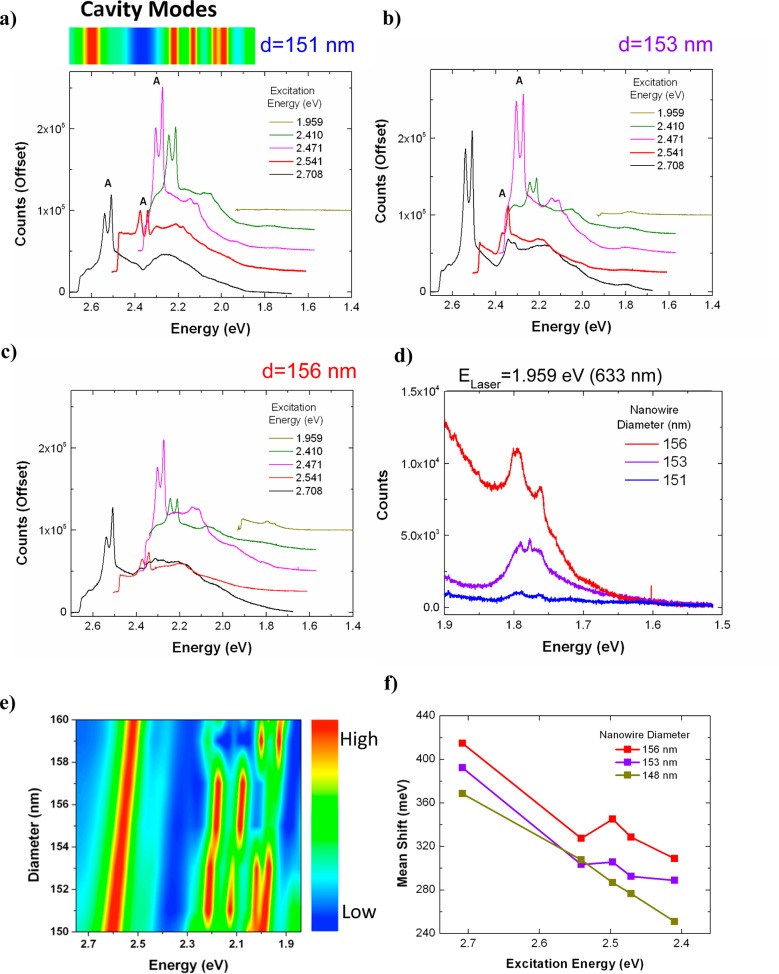
Figure 4.
(a–c) Photoluminescence spectra of plasmonically coupled nanowires excited at various laser energies in the range 1.959–2.708 eV for nanowires of size (a) d = 151 nm, (b) d = 153 nm, and (c) d = 156 nm (all spectra are offset by 25 000 counts for clarity). The cavity mode spectrum of the d = 151 nm nanowire is plotted on top of the photoluminescence spectra (high in red to low in blue) using the same energy scale. The variable energy excitation photoluminescence spectra demonstrate the role of mode structure in modulating high intensity subpeaks. In addition to size-dependent peak modulation, the modes, which redshift with increasing size, also enable hot luminescence at lower energies for larger nanowires. (d) Photoluminescence spectrum in low-energy region (excited with 633 nm, He–Ne laser) for samples (a–c). (e) Simulated cavity mode spectra of plasmonically coupled silicon nanowires with diameters in the range d = 150 to 160 nm as a function of energy. (f) Difference between the average emission energy and exciting laser energy (i.e., the mean emission shift) plotted against excitation energy. Large fluctuations in mean emission intensity as a function of size and excitation energy highlight the role of both cavity modes and electronic structure in modulating the emission spectrum.

