Figure 5.
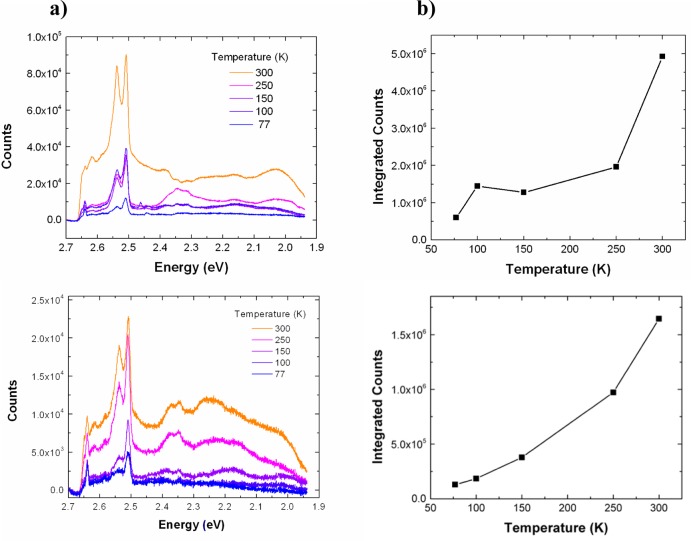
(a) Temperature-dependent photoluminescence spectra of plasmonically coupled silicon (for two different samples) in the range 77–300 K. The increase in overall emission intensity with temperature follows the expected trend for hot luminescence from an indirect bandgap material as the phonon population increases with increasing temperature. (b) Plot of total integrated counts as a function of temperature for samples shown in (a).

