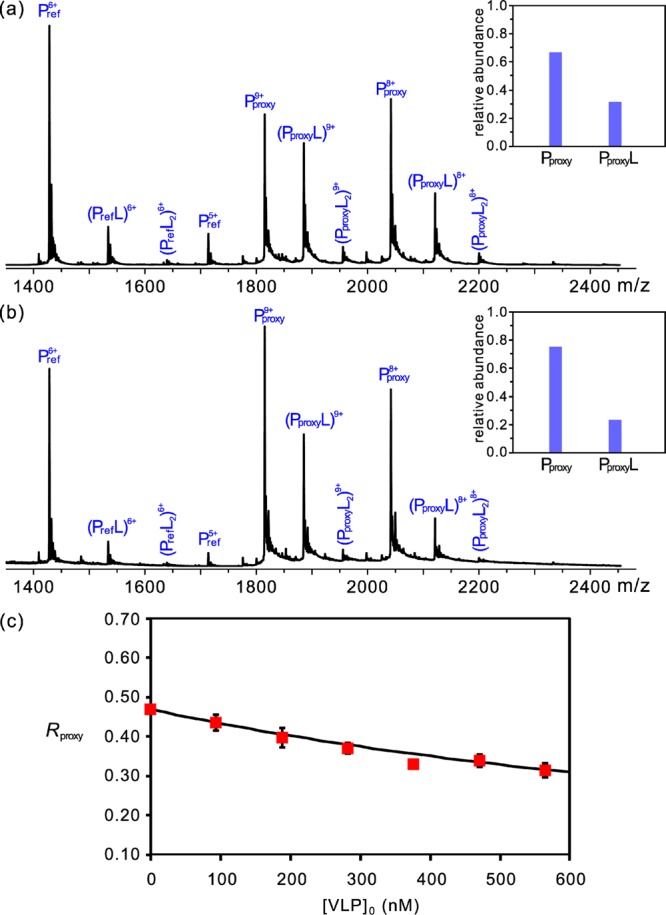
Figure 3.

Representative ESI mass spectra measured in positive ion mode for aqueous ammonium acetate solutions (160 mM, pH 7 and 25 °C) of Pproxy (Gal-3C, 3.0 μM), Pref (Ubq, 1.0 μM), and GM3 trisaccharide (40 μM) without (a) or with (b) NoV VA387 VLP (570 nM, 180-mer). Insets show the fraction of free and GM3-bound Pproxy, after correction for nonspecific ligand binding. (c) Plot of the abundance ratio of GM3-bound Pproxy to free Pproxy (Rproxy) versus VLP concentration. The solution conditions for each measurement were the same as in (a), but with the addition of VLP. The curve represents the best fit of eq 5 to the experimental data.
