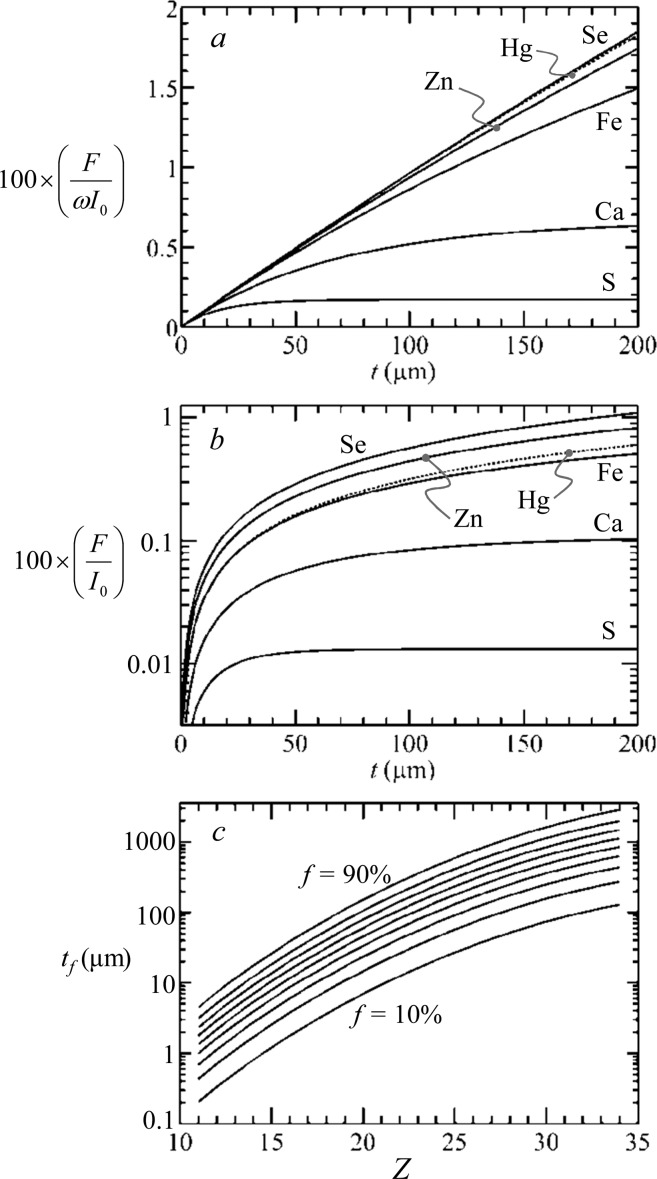
Figure 19.
Fluorescence signal depth attenuation. Curves are calculated for selected biologically relevant elements, but omitting the solid angle term (β/4π) in eq 6; (a) shows the fluorescence signal without accounting for fluorescence yield ω,32 and (b) shows the same data including fluorescence yield but on a logarithmic scale. Curves of the required thickness tf for 10% increments between 90% and 10% of the maximum possible signal are shown in (c) plotted against the atomic number Z of the fluorescing element (eq 8). In all cases, the absorption was approximated by that of water, with an incident X-ray energy of 13 450 eV, and both θ and φ set to 45°.

