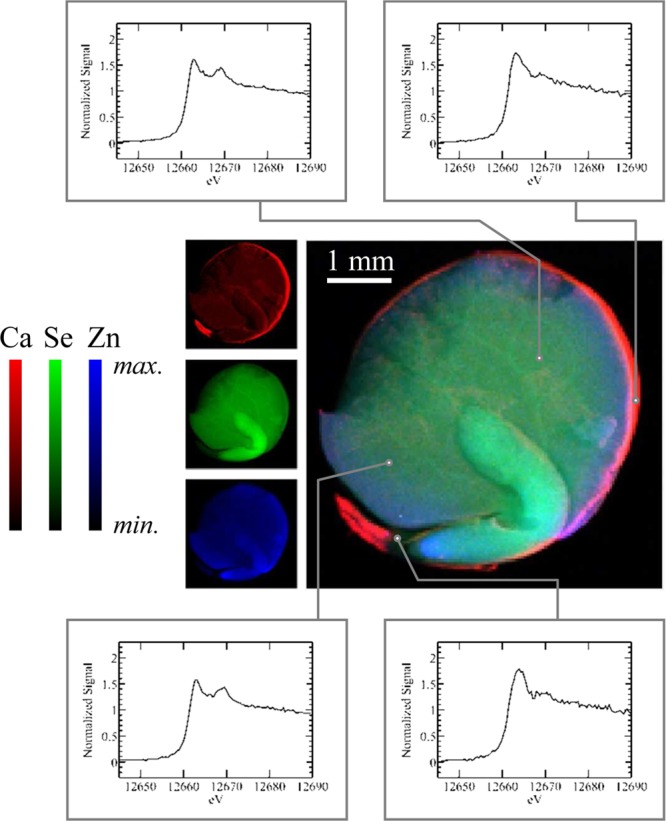
Figure 20.

Example μ-XAS experiment on selenium in a red lentil seed (Lens culinaris). The central image shows the X-ray microprobe results with Ca, Se, and Zn, indicated as red, green, and blue, respectively. Selected locations on the image, as indicated, were then interrogated by using μ-XAS, with the different spectra indicating the presence of chemical differences between the different parts of the lentil seed. Data were collected on SSRL 9-3 using a glass monocapillary with a 6 μm exit (focal length 2 mm).
