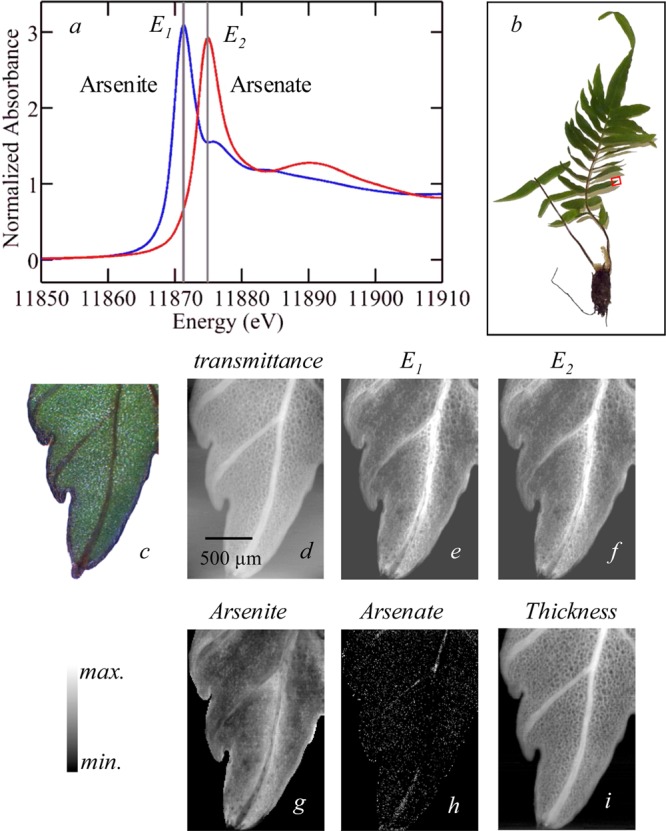
Figure 21.

Chemically specific imaging of the fern Pteris vittata. The X-ray absorption spectra of standard solutions of arsenite and arsenate are compared in (a), and the incident X-ray energies selected for imaging are indicated as E1 and E2. The tip of one pinna (leaf) was selected for imaging (b), and the raw imaging data are shown in (d)–(f) with a micrograph (c), X-ray absorbance (d), and X-ray fluorescence at E1 (e) and at E2 (f). Using eqs 4 and 5, the analyzed data in (g)–(i) are obtained, with the concentration of arsenite (g) and arsenate (h), with maxima of 40 and 2 μM, respectively. The thickness (i) has a maximum value of 0.2 mm. Adapted with permission from ref (28). Copyright 2006 American Chemical Society.
