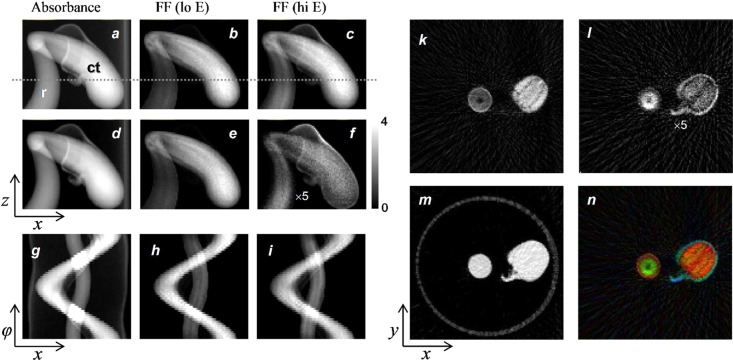
Figure 25.
Chemically specific fluorescence tomographic reconstruction of a seedling from the selenium hyperaccumulating plant Astragalus bisulcatus. Absorbance (a) and fluorescence X-ray maps at low (b) and high energies (c) (12 661.08 and 12 667.28 eV, respectively) together with thickness (d) and chemically specific maps (amounts) for Se-methyl-selenocysteine (e), and selenate (f). The radicle (r) and cotyledons (ct) are shown in (a). Sinograms for absorbance (g) and fluorescence at low (h) and high (i) energies are also shown. The dotted lines in (a)–(c) show the z-value used for the tomography. Tomographic reconstruction of the data in (a)–(i) is shown in (k)–(n), the tomogram for Se-methyl-selenocysteine (k), selenate (l), and transmittance (m). The tricolor plot in (n) compares the localizations of Se-methyl-selenocysteine (red), selenate (green), and calcium (blue). The circle visible in the tomographic reconstruction of transmittance (m) corresponds to the sample support, a clear plastic metal-free drinking straw. The faint radial structures visible in the figure are artifacts of the tomographic reconstruction. Data were collected on SSRL 9-3.

