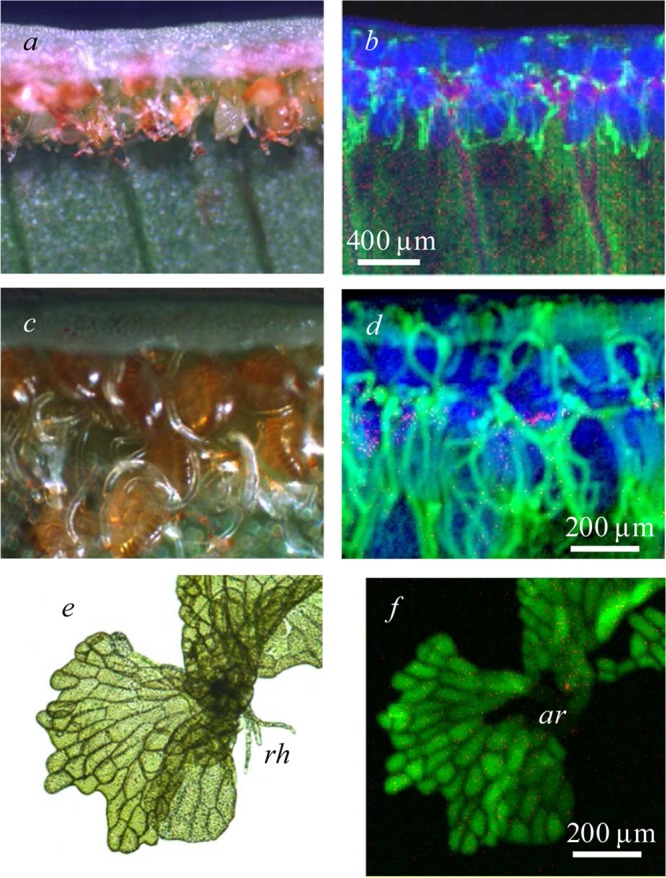
Figure 30.

X-ray fluorescence imaging of Pteris vittata reproductive tissues.28 In the figure, (a), (c), and (e) show optical micrographs, and (b), (d), and (f) show XFI images with arsenate in red, arsenite in green, and thickness (transmittance) in blue. The sporangia of the sporophyte generation are shown at different resolutions in (a)–(d) and the gametophyte in (e) and (f). The future site of archegonial development is shown in (f) (ar), and several rhizoids (rh) are visible in (e). Adapted with permission from ref (28). Copyright 2006 American Chemical Society.
