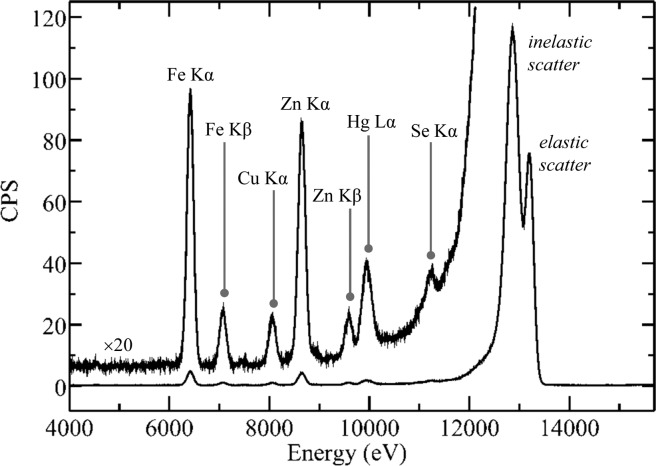
Figure 9.
Biological X-ray fluorescence emission spectrum. The spectrum shown is that of a sample of human cerebral cortex from an individual poisoned through skin exposure to dimethylmercury, plotted with counts per second (CPS) on the ordinate. Two copies of the trace are shown, one full-scale, and the other (labeled) with the vertical scale expanded by a factor of 20. The spectrum was collected using a Canberra LeGe detector using analog electronics with a Gaussian shaping amplifier employing a shaping time of 2 μs. The incident X-ray energy was 13 200 eV. Data were collected on SSRL 9-3.

