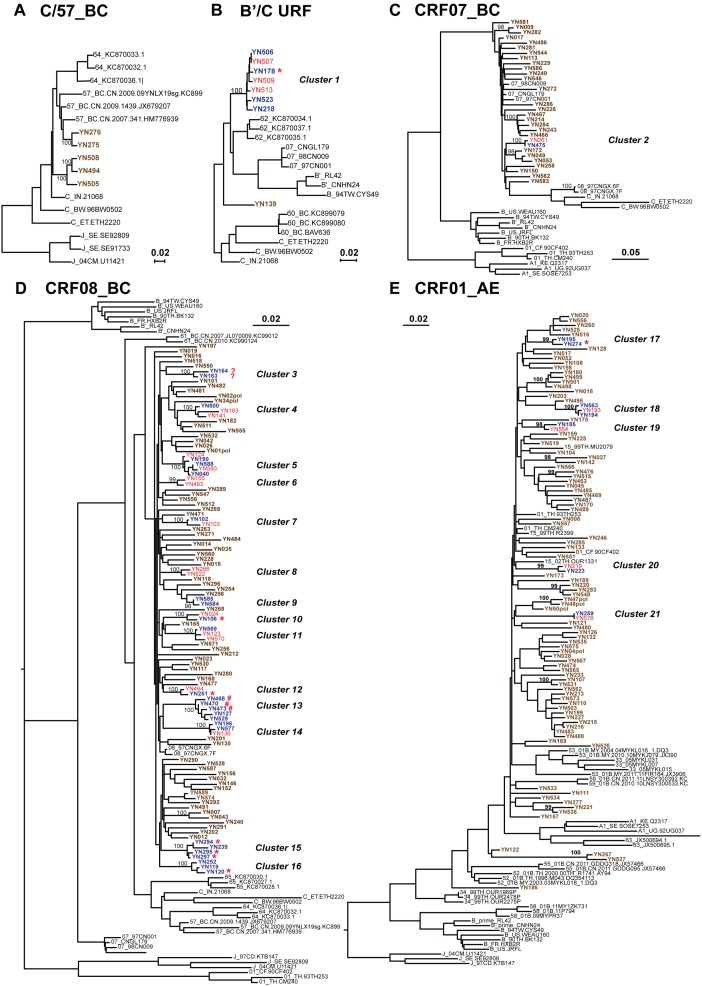
Figure 4. Maximum likelihood tree representing the phylogenetic relationships between HIV-1 infectors in Banna.
The whole alignment was split into 6 sub-datasets based on their genotypes, and phylogenetic reconstructions were implemented on each sub-dataset after gag stripping. A total of 21 transmission clusters were identified according to the criteria (bootstrap value>98% and branch lengths<0.015). Sequences composed these clusters were highlighted in blue (male) or red (female), and behind the sequence names, their transmission routes except for heterosexual contact were indicated with asterisk (*, injection drug use), pound sign (#, men who had sex with men) or question mark (?, uncertain) respectively. Unrelated sequences and reference sequences were showed in blown or black respectively.

