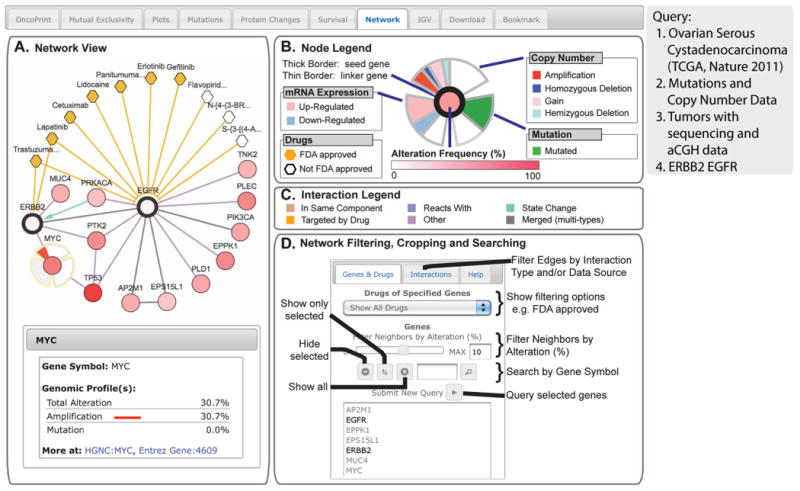
Fig. 8. The Network tab.

The example shows network analysis of EGFR networks in serous ovarian cancer. (A) Network view of the EGFR and ERBB2 neighborhood in serous ovarian cancer (TCGA data set) rendered with Cytoscape Web (34).The query genes, EGFR and ERBB2, are outlined with a thick border, and nearest neighbor genes are color-coded by their alteration frequency in ovarian cancer. One can display drugs that target EGFR or ERBB2 (hexagons; orange indicates FDA-approved), as well as details about genomic alterations and links to external resources for any gene in the network (bottom left, example MYC). (B) The “Gene Legend” accessed from the “Legend” button. Mousing over any gene in the network or single-clicking the gene displays multidimensional genomic data (copy number, mutation, and mRNA expression) onto all nodes in the network. (C) The “Interaction Legend” accessed from the “Legend” button. Double-clicking the edge displays additional details about the interaction between the two nodes. Edges can represent different interaction types (color-coded, such as “reacts with”). (D) Options for filtering, cropping, and searching the network are shown.
