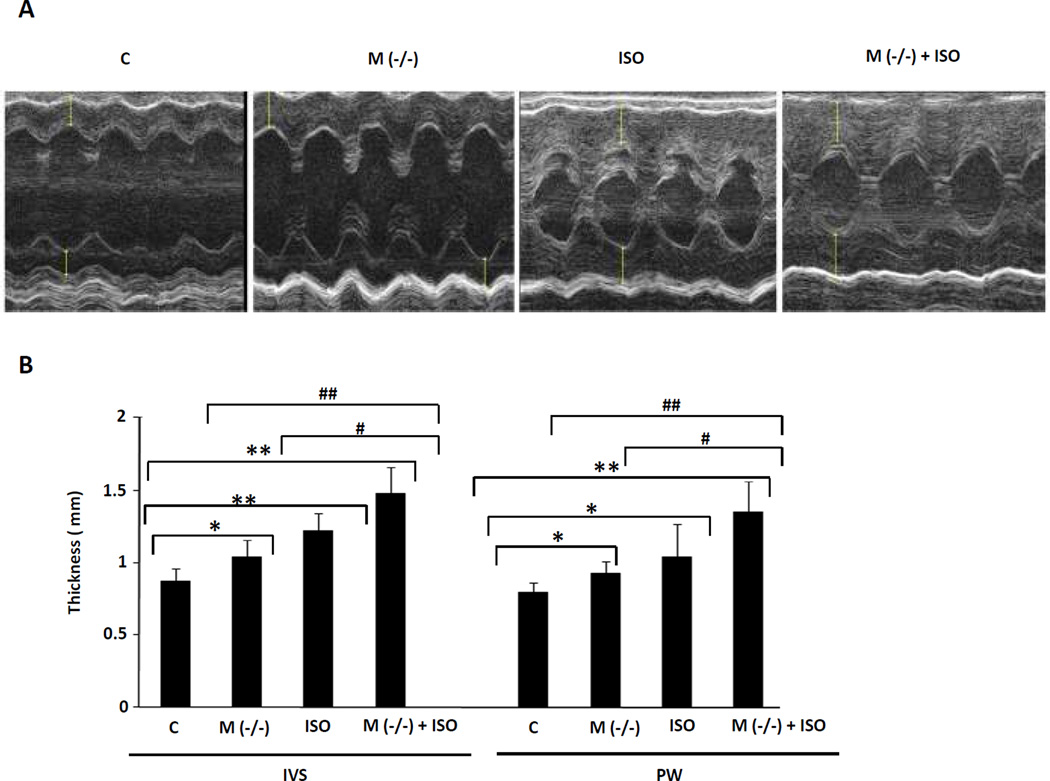
Fig. 5.
Echocardiography of mice with cardiomyocyte-specific VDR knockout in presence or absence of ISO infusion. A: Representative M-mode images are demonstrated. B: Thickness of interventricular septum (IVS) and posterior wall (PW) was measured and bar graphs displaying mean and standard deviation from n=6–8 per group are shown. *P<0.05, **P<0.01 vs. control. #P<0.05, ##P<0.01 vs. M(−/−) + ISO.

