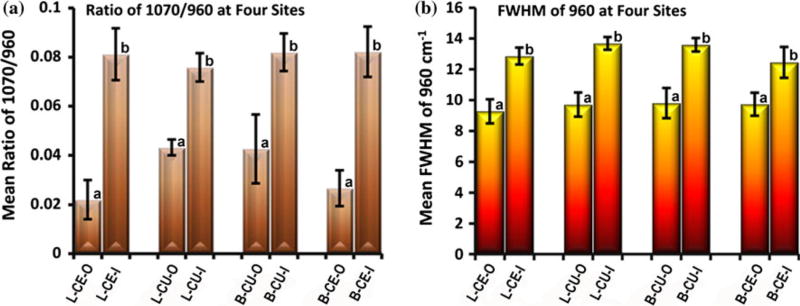
Fig. 7.
(a) Mean ratios of 1070 cm−1/960 cm−1 (carbonate/phosphate) and (b) mean FWHM of 960 cm−1 (phosphate peak width) in outer and inner enamel at four sites/tooth (n=5 teeth): Lingual cervical outer/inner (L-CE-O/L-CE-I); Lingual cusp outer/inner (L-CU-O/L-CU-I); Buccal cusp outer/inner (B-CU-O/B-CU-I); Buccal cervical outer/inner (B-CE-O/B-CE-I). Error bars represent SD. The ratio and peak width are significantly lower (P<0.05) in outer enamel at each site (similar subsets indicated as a or b in each graph)

